Order Block For Indian Traders
Order blocks for Indian traders, in simple pictures: why your stop gets taken, where big money waits, and how to see the zone early, not after the move.
You spot a stock bouncing and join in. Your stop goes just under the morning's low, where it feels safe. Half an hour later, one candle dips under that low and takes your stop. Then the stock climbs and keeps climbing. Without you.
If that sounds like your week, you are not unlucky. You are standing exactly where big money expects you to be.
Every morning at 9:15, more than 200 F&O stocks start to move. Big players (mutual funds, foreign investors, prop desks) push crores of rupees into them. Money that big can't hide. It leaves footprints on the chart, and the biggest is called an order block.
Most traders find these footprints after the move is over. This guide explains order blocks for Indian traders in simple pictures. You will see one trading day twice: first as the trap, then the way OrderBlock sees it.
Why most traders arrive late
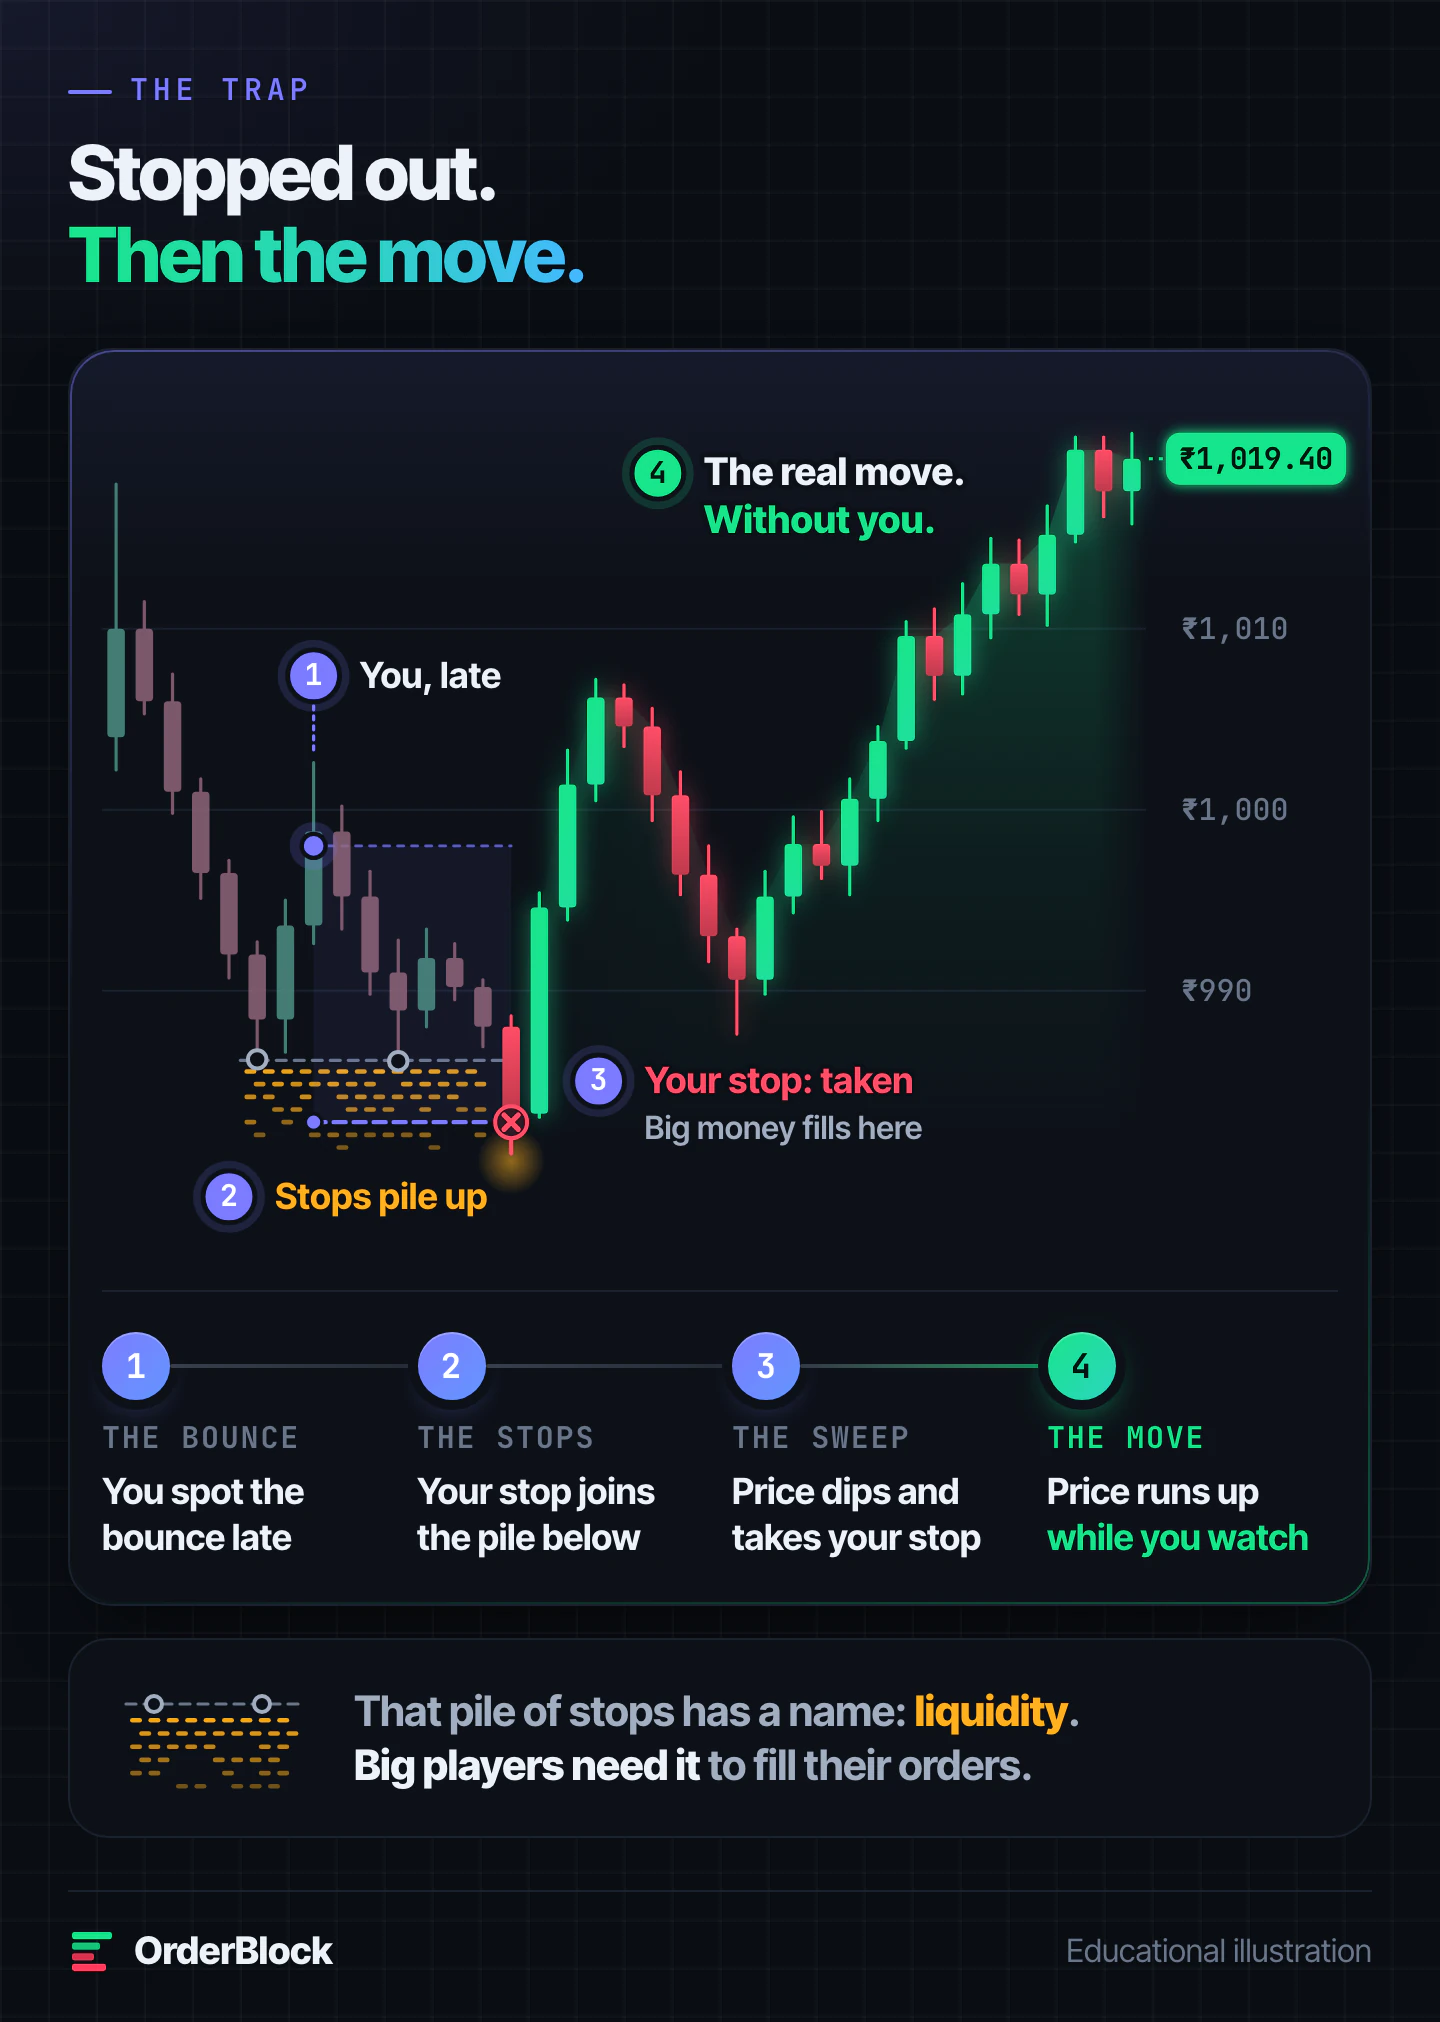
Here is that morning, step by step. The stock slides, bounces, and you join late.
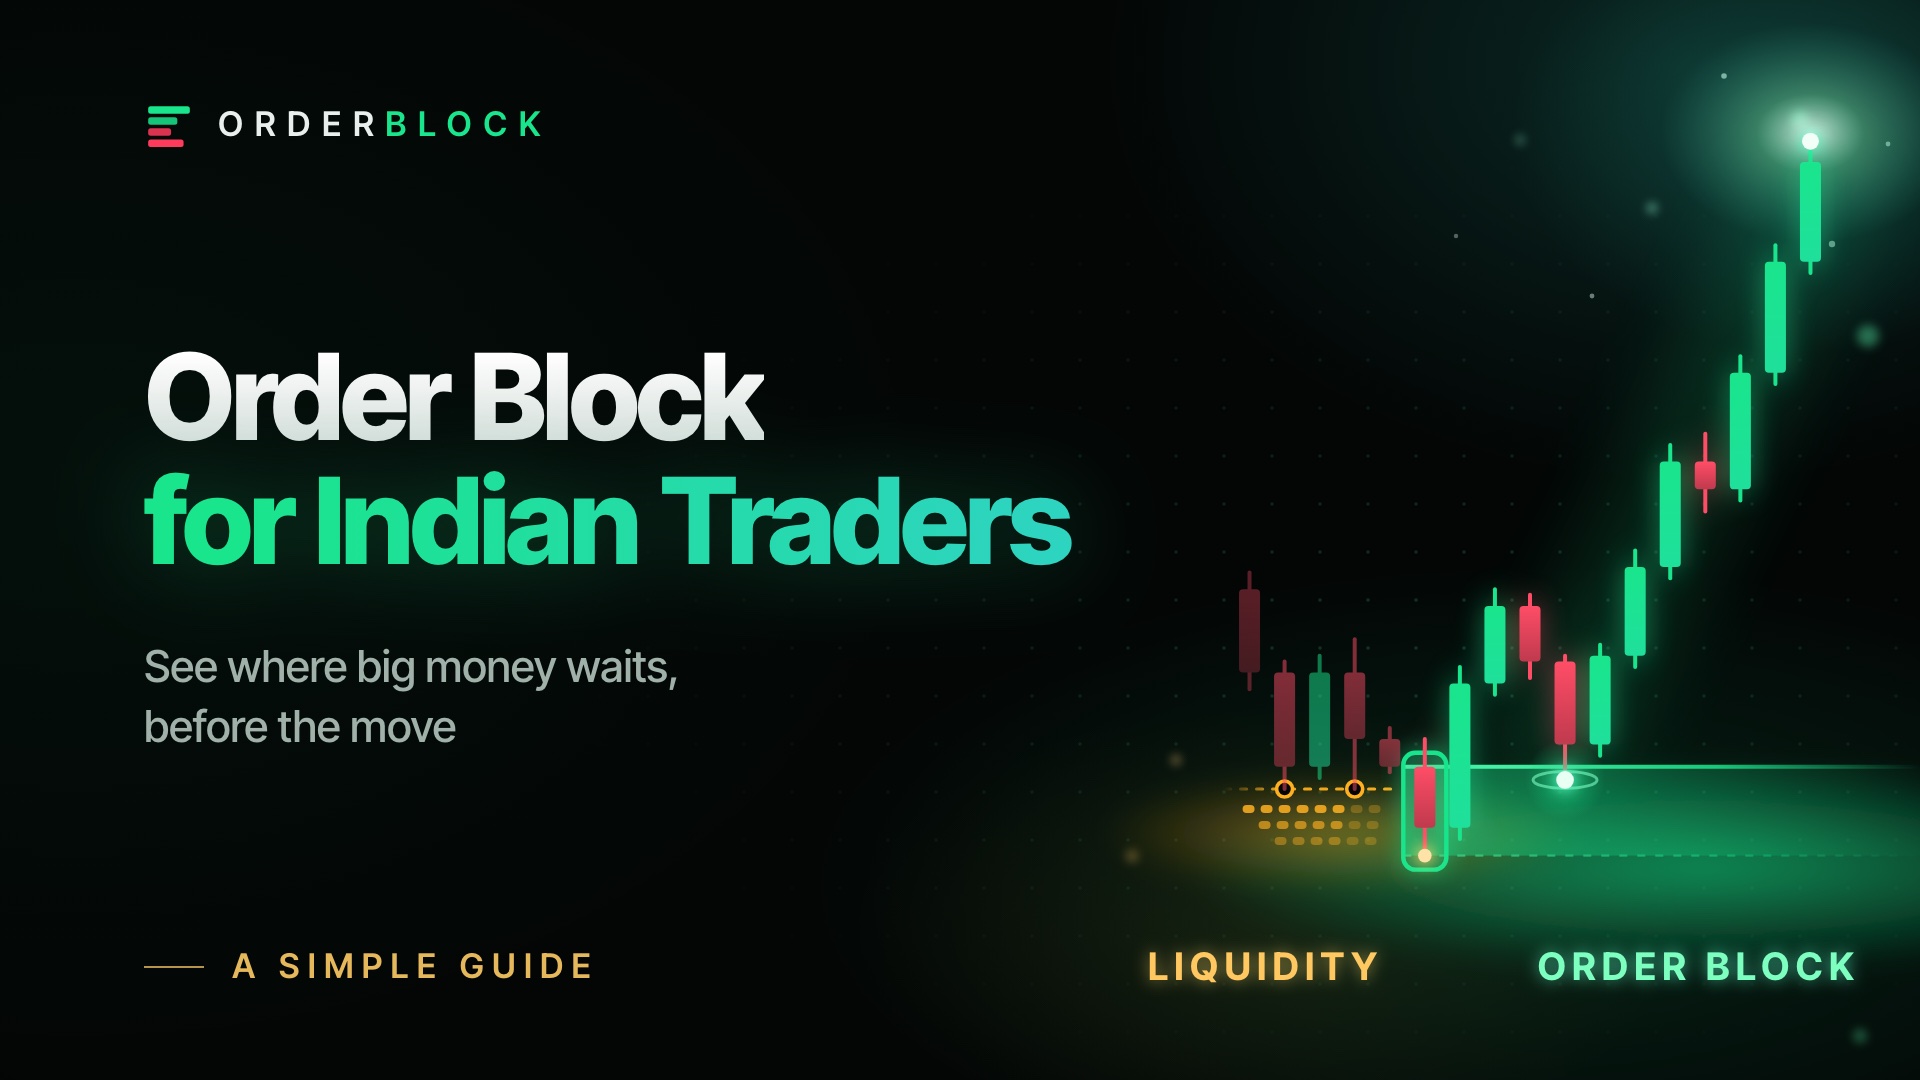
Soon price comes back to the same low and turns there again. Two lows at the same price are called equal lows, and everyone can see them. So most traders put their stops just under them, right next to yours.
Then one candle dips through and sets off the whole pile. Price turns up right after.
That pile of stop orders has a name: liquidity. Big players need it. A huge order needs lots of matching orders at once. A cluster of stops gives them exactly that, in seconds.
What is an order block?
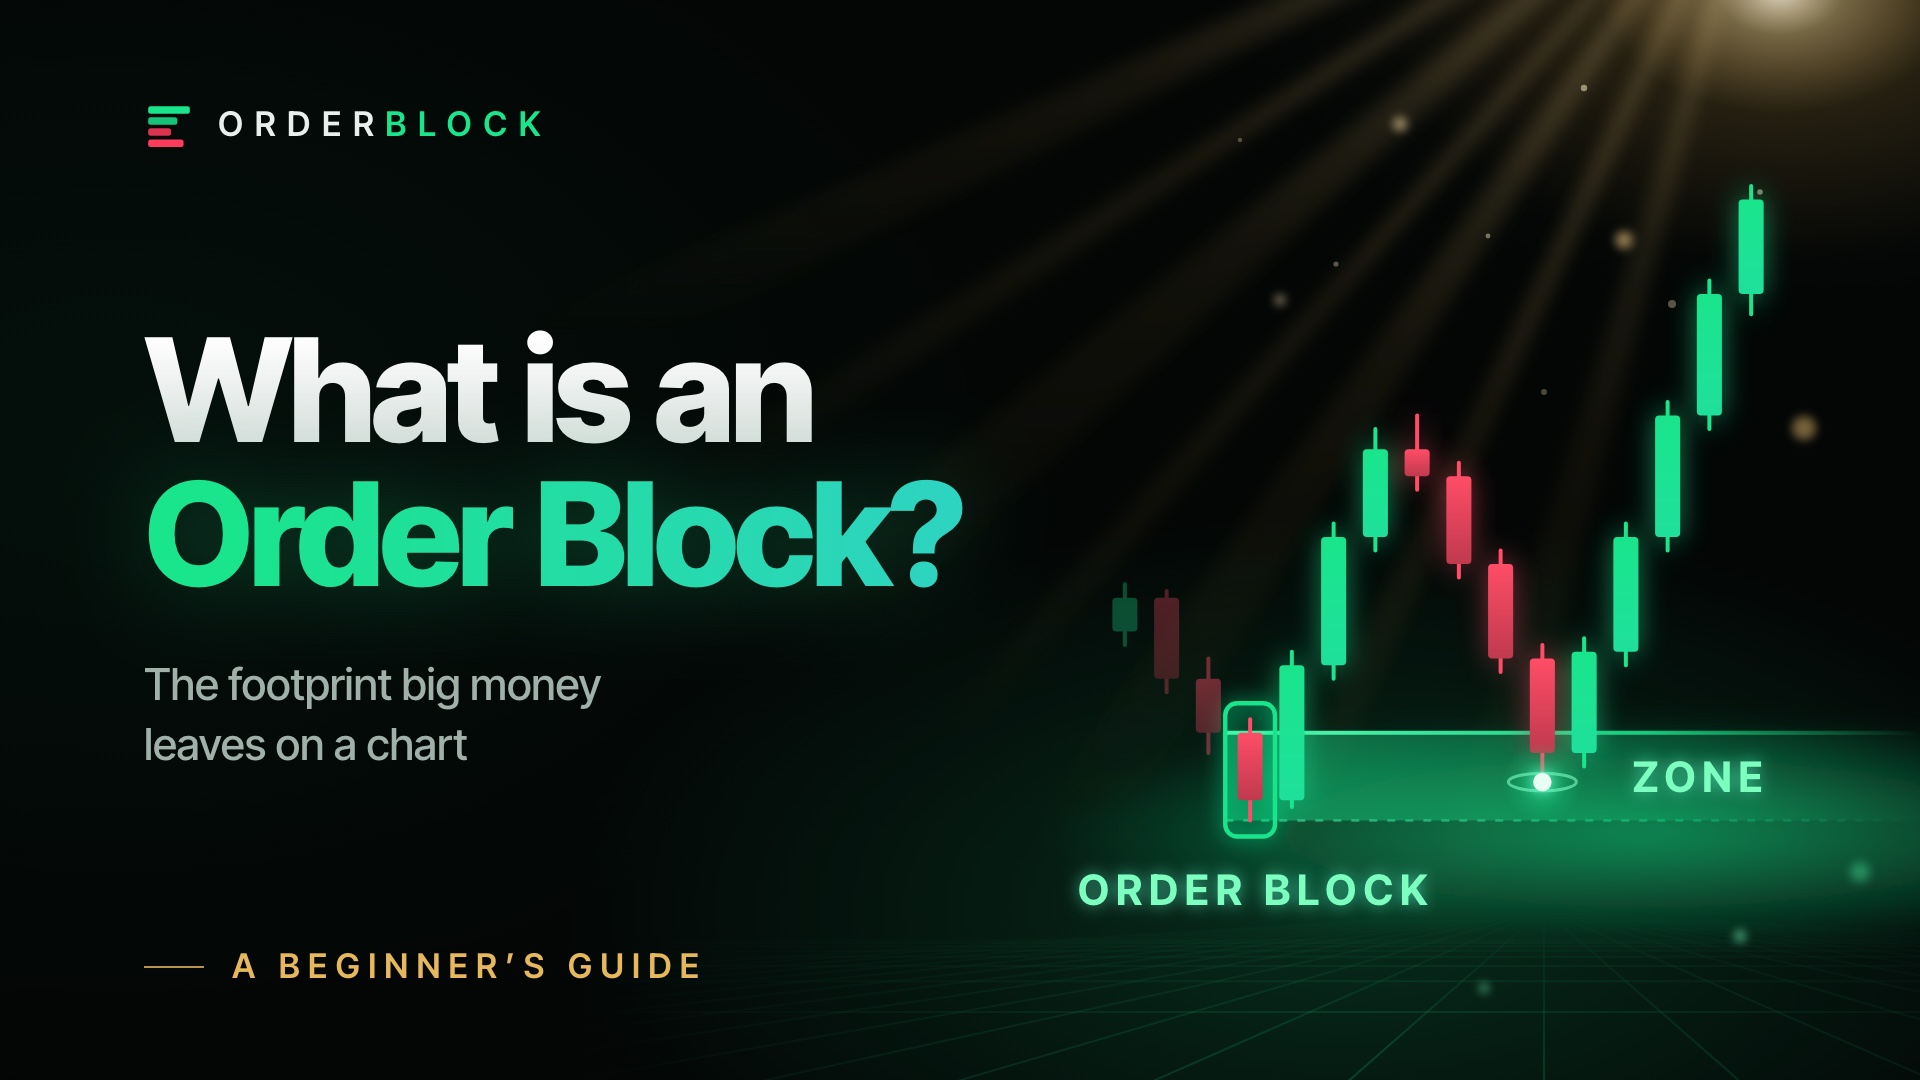
An order block is the zone where big players likely left orders before a strong move, and price often comes back to it.
Picture a big wholesaler at an onion mandi. He wants a full truckload at ₹20 a kilo. Only a few sacks are on offer at that price. He takes them, and the price jumps, because nothing is left at ₹20.
He won't pay ₹25 for the rest. So he waits at ₹20, and when the price drifts back, he is there. His waiting orders are the order block.
Big players in F&O stocks have the same problem, with lakhs of shares instead of sacks. They fill what they can, price runs away, and the rest of their orders wait at the zone. When price comes back, those orders can turn it again.
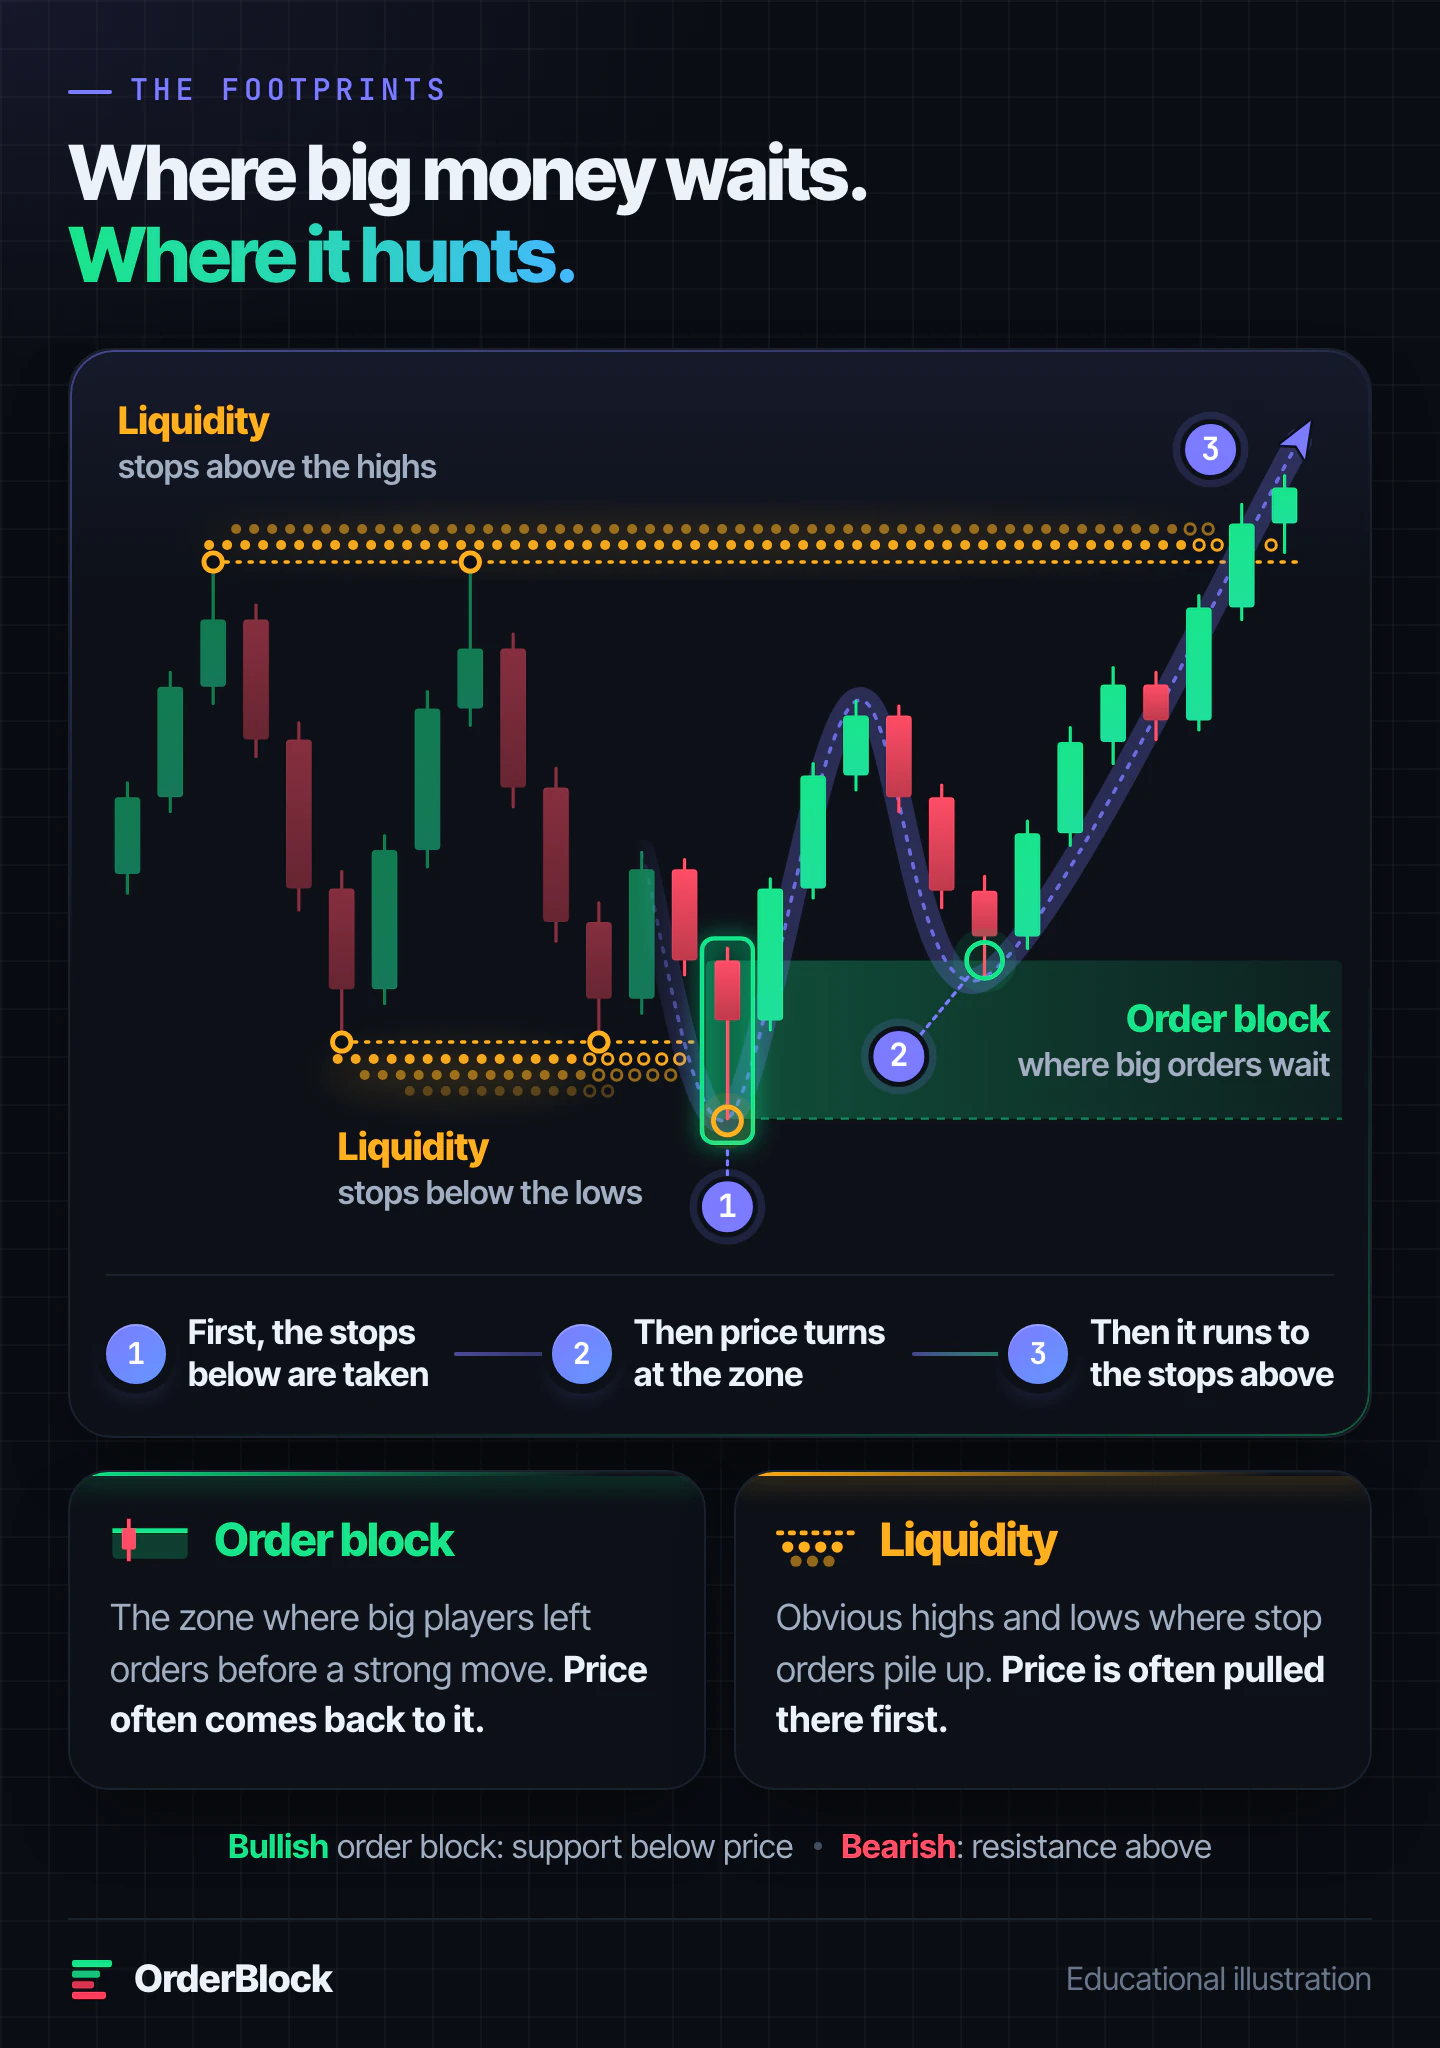
A bullish order block is the last red candle before a strong rise. It sits below price as support. A bearish order block is the mirror: the last green candle before a strong fall, with resistance above.
Now look back at our morning. The red candle that took your stop was the last one before the rise. It was the order block.
For the full definition, read our beginner's guide to order blocks.
Why one chart can't show a real order block
So why didn't you see it coming? The shape itself is easy. Find a red candle before a rise, and there it is. That is exactly the problem: every chart has dozens of them.
Most are lookalikes with nobody behind them. A real one and a lookalike can show the very same candles. Your eyes can't tell them apart. Only the data behind the chart can.
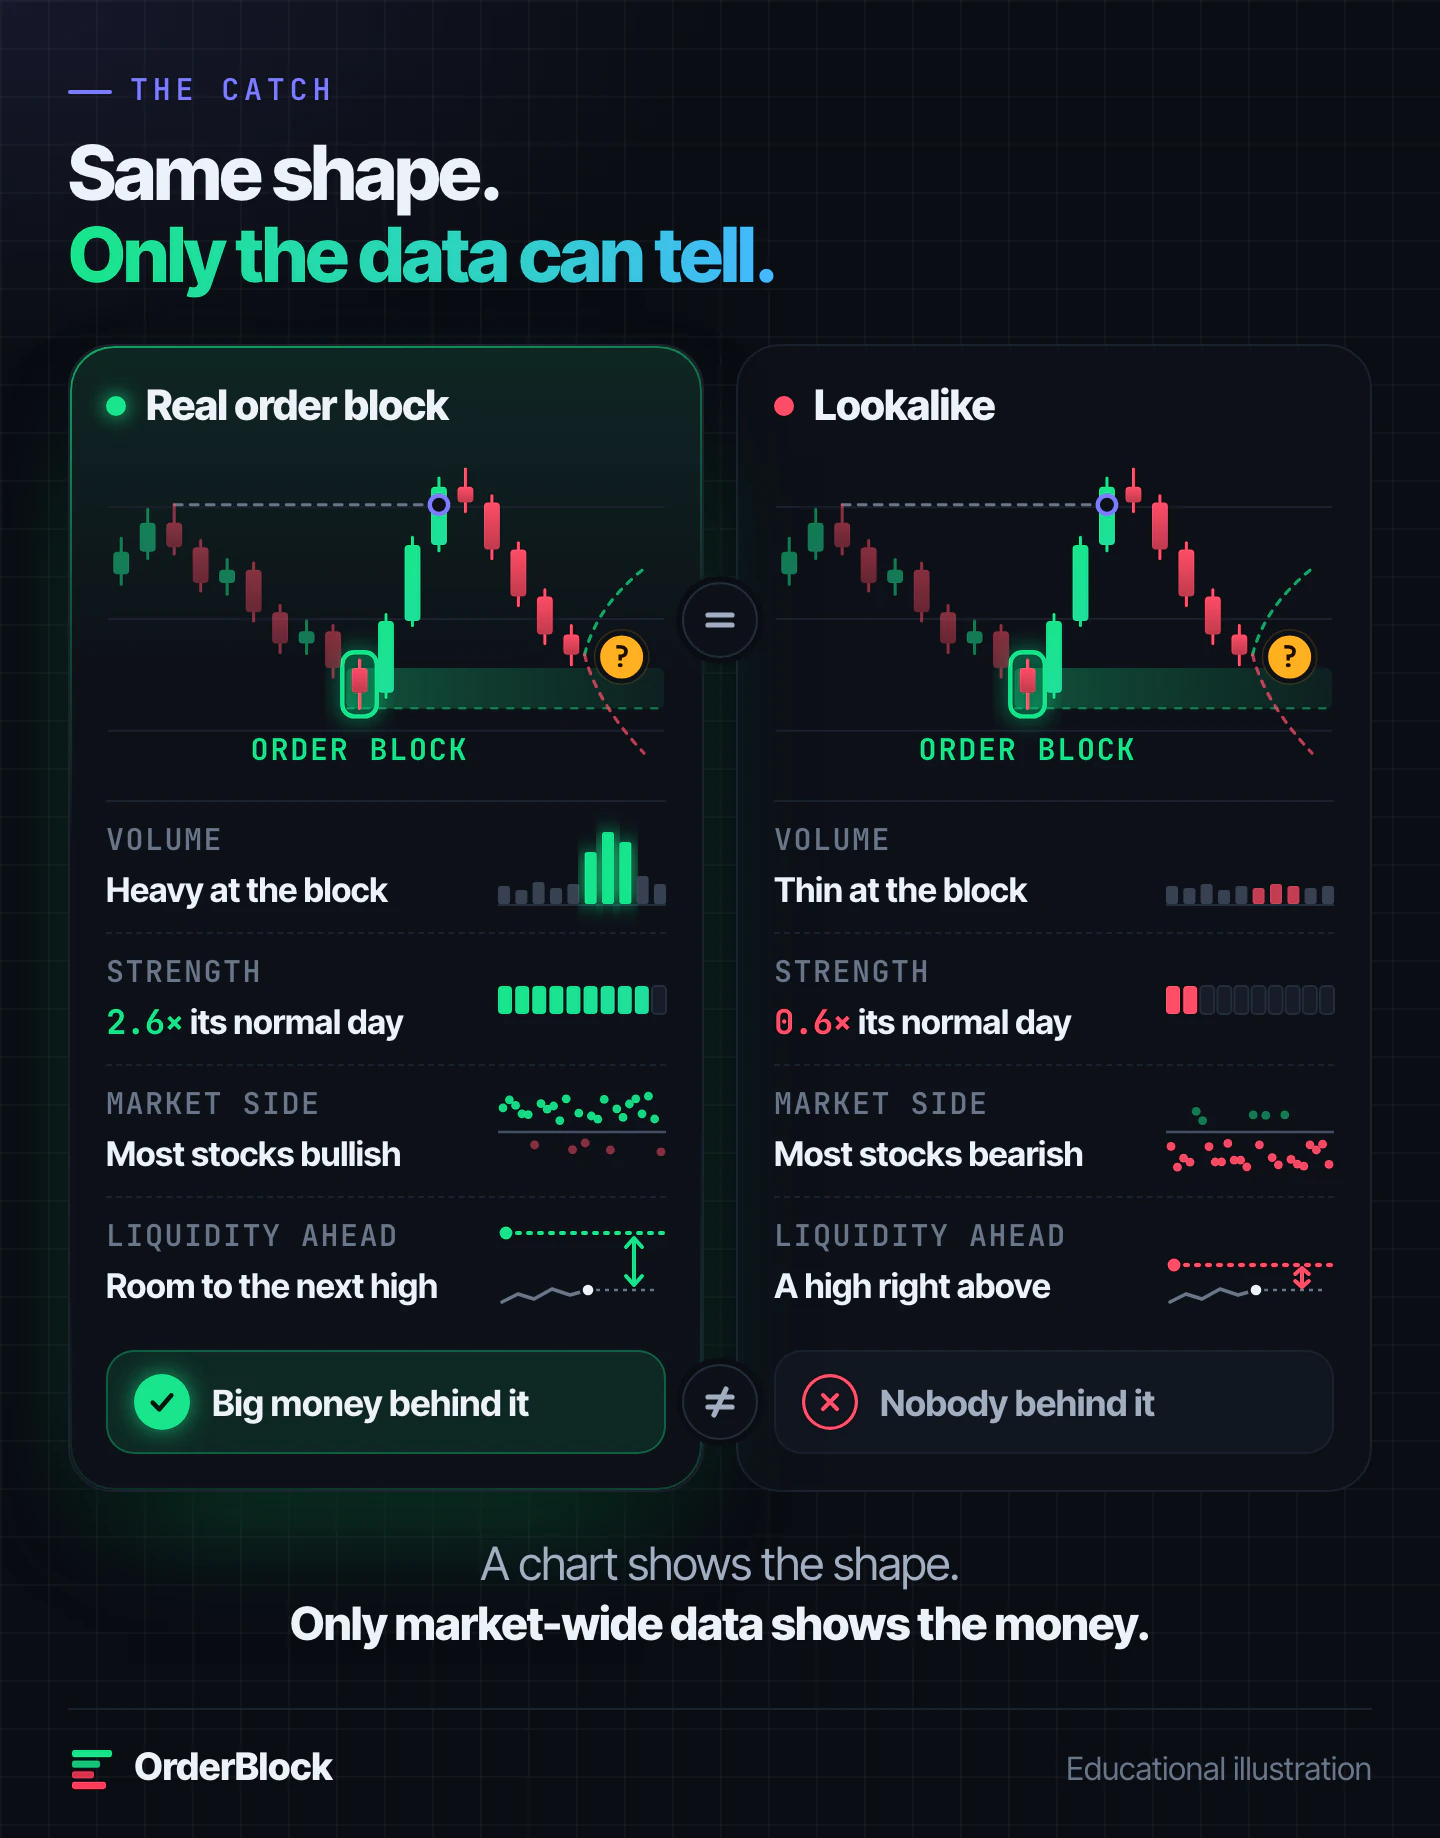
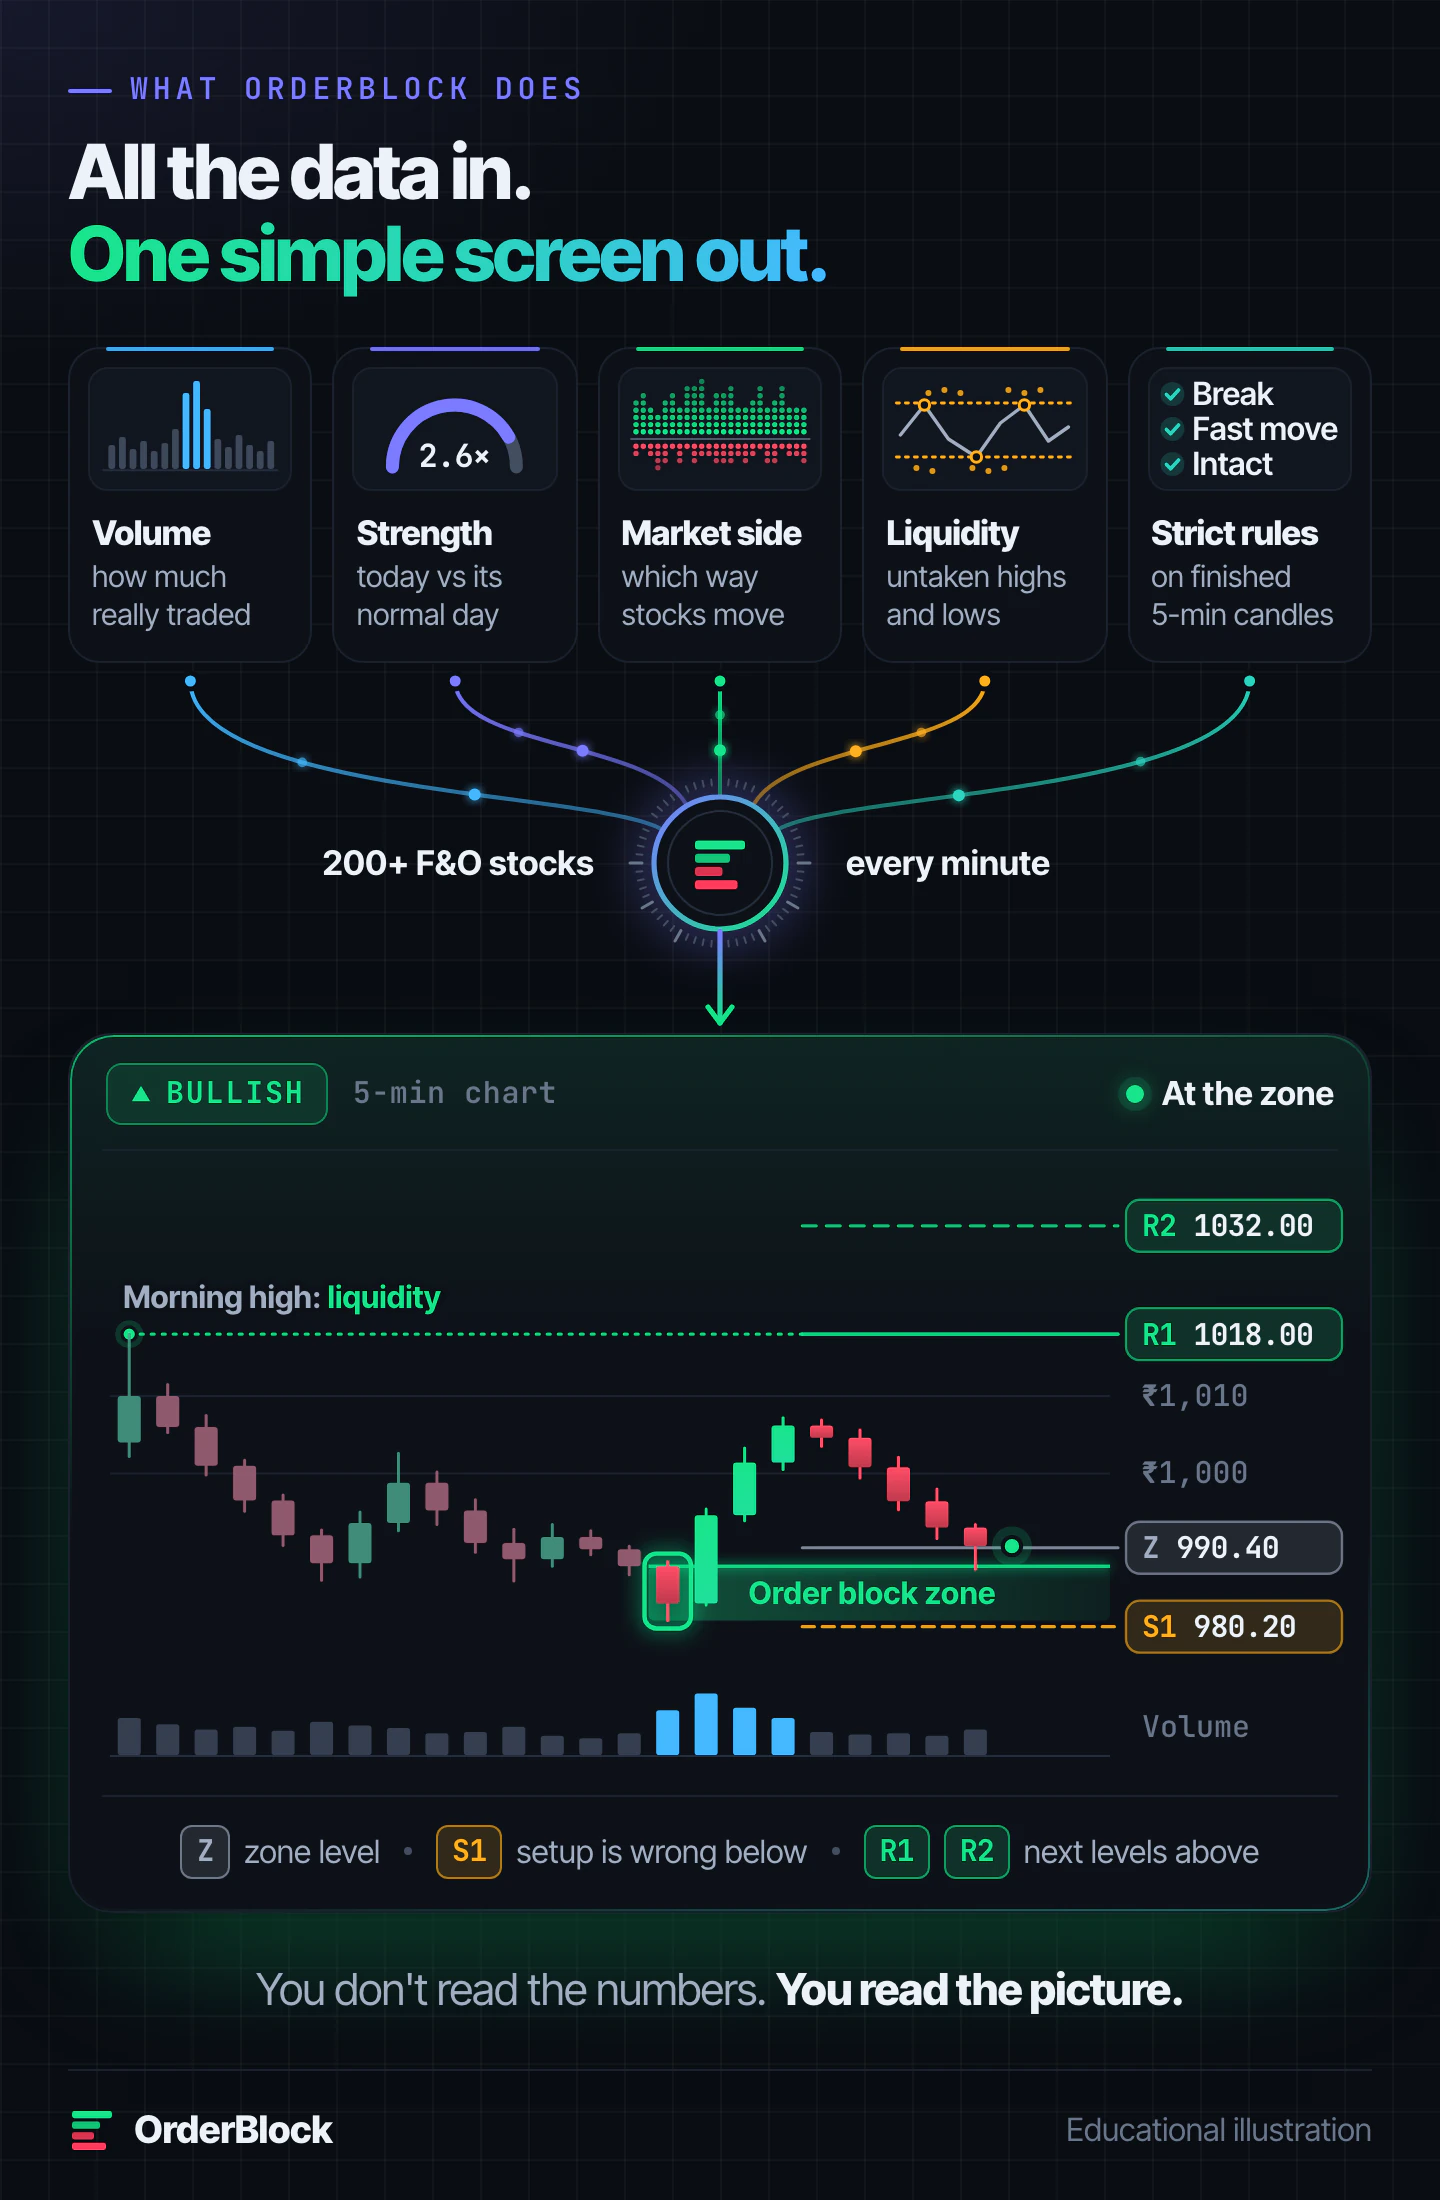
To know which one is real, you need five answers:
- Volume: where and how much of the stock really traded, and whether it was heavy at the zone.
- Strength: how far and how cleanly the stock is moving today, compared with its normal day.
- Market side: which way most of the 200+ F&O stocks are moving right now.
- Liquidity: the highs and lows no candle has closed beyond yet, where stop orders pile up.
- Strict rules: the same tough checks on every finished 5-minute candle, so weak lookalikes are filtered out.
That is data on the whole market, not one chart.
Why you can't do it by hand
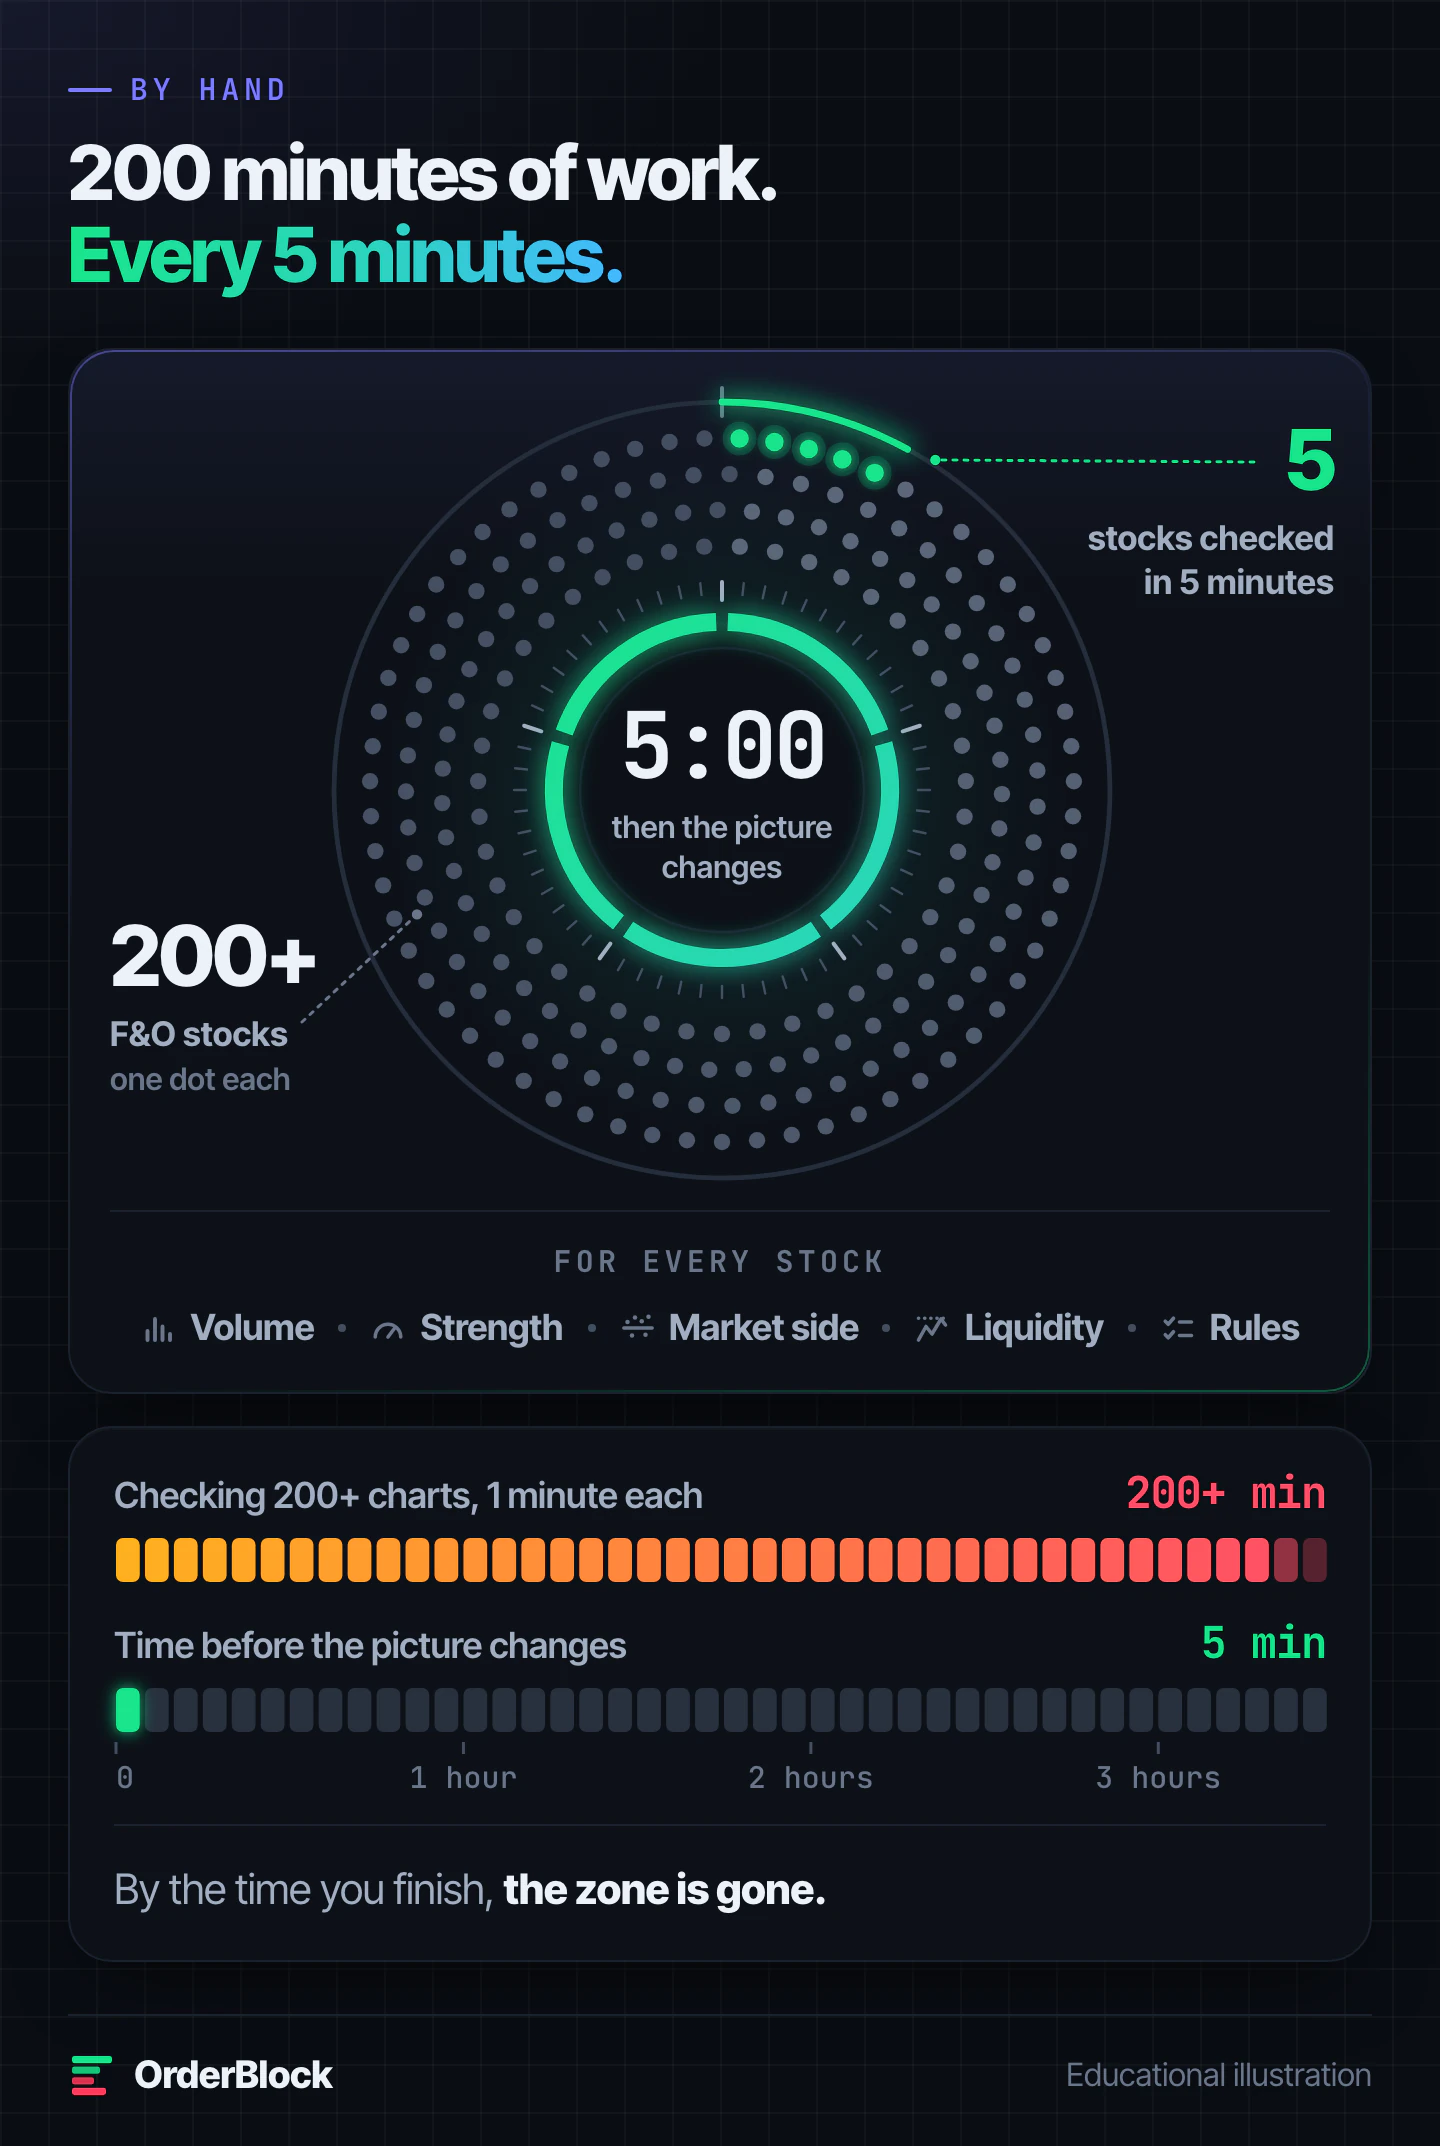
There are more than 200 F&O stocks. Each makes 75 five-minute candles a day: over 15,000 candles. At one minute a chart, one pass takes over three hours. Even reading which side the market is on is a job of its own.
Meanwhile, the picture changes every 5 minutes. Highs break, new zones form, old ones fail. And by hand, the zones you draw change with your mood. After a loss, every red candle looks like an order block. You chase instead of letting the zone come to you.
OrderBlock: the whole market's data on one simple screen
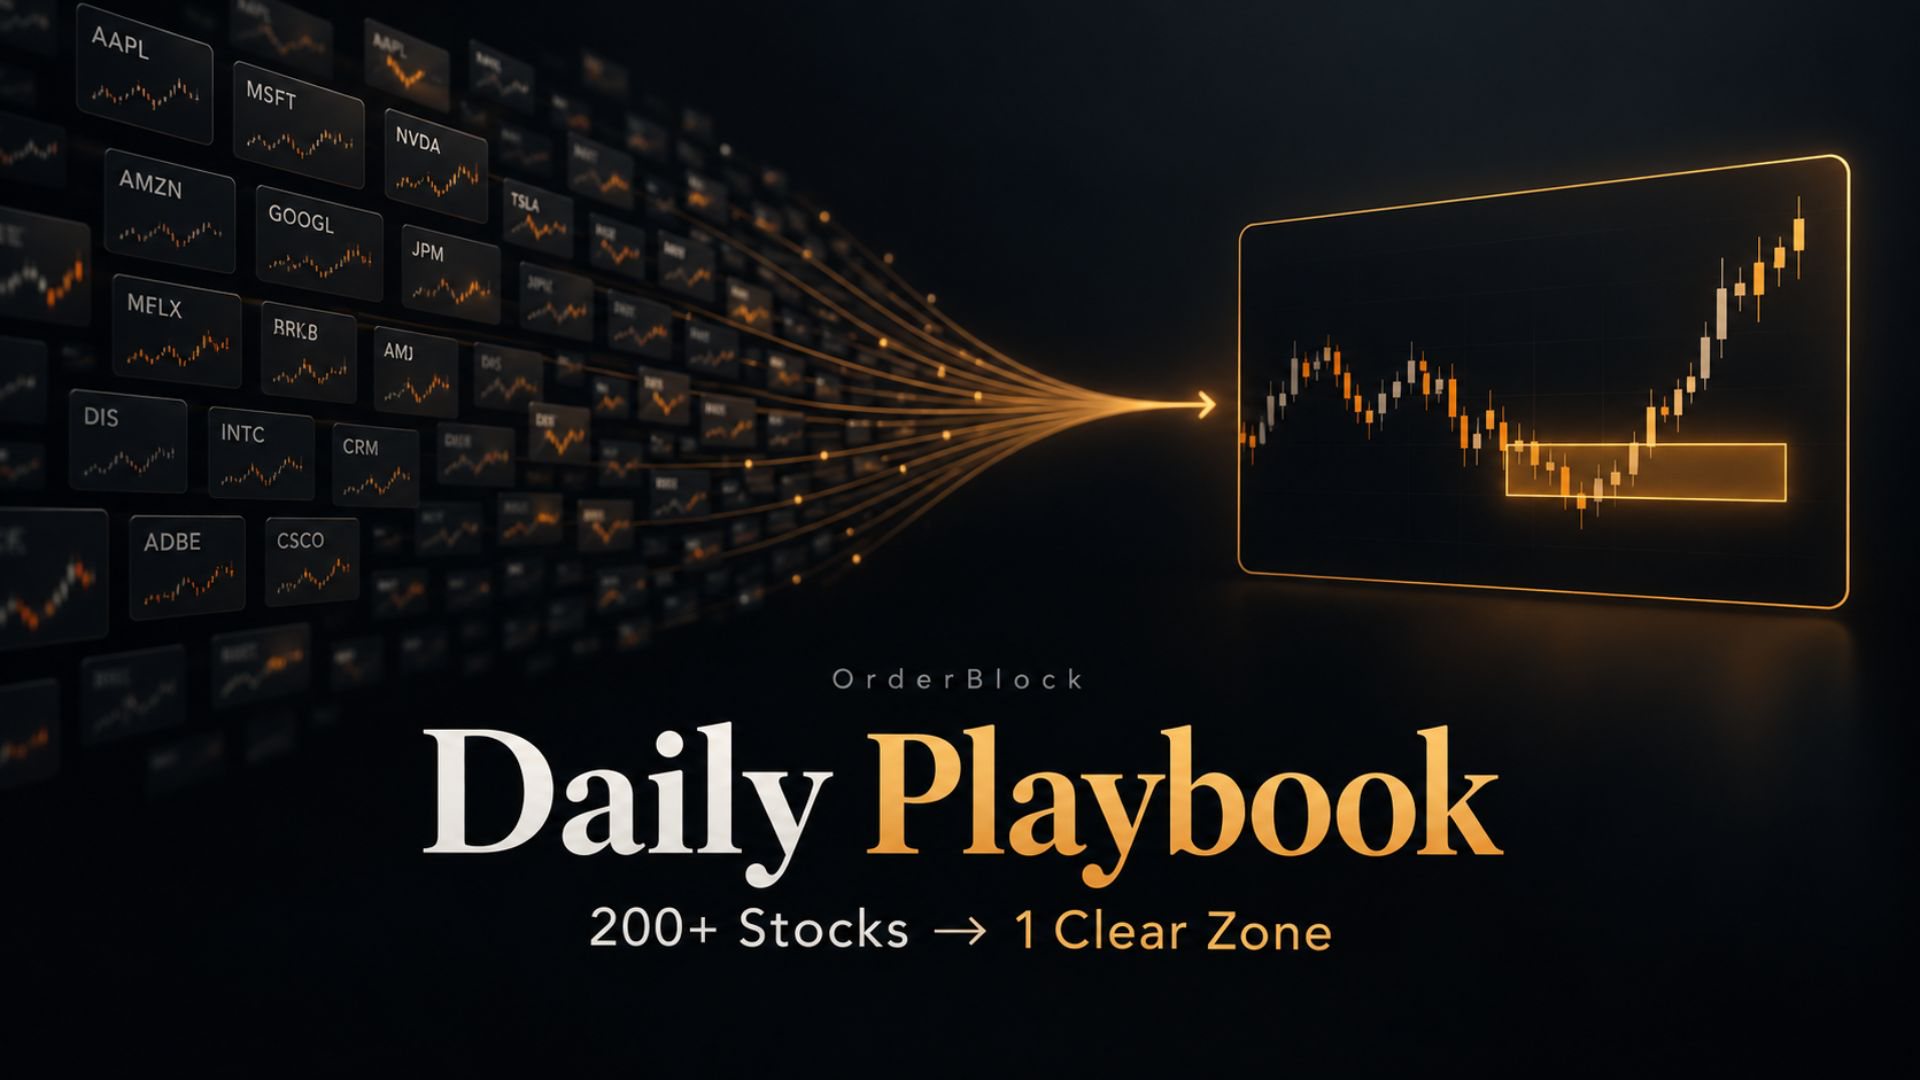
Consistent trading needs the same rules on every chart, every minute. That is why we built OrderBlock. Every minute, it checks all 200+ F&O stocks. It ranks each one by strength: today's move compared with its normal day. It reads the volume and shows which side the market is on. The 20 strongest on each side make the Bullish and Bearish boards.
On each of those 40 stocks, it draws the order block zone with strict rules and marks four levels. Z marks the zone. S1, just below it, is where the idea is wrong. R1 and R2 are the levels ahead, placed at an old high where stops are waiting whenever one is in reach. A bearish chart is the mirror. Then a shortlist of 6 picks 3 top-ranked stocks from each side, fresh every minute. You read one simple screen, on your phone or computer, not 200 charts.
Because it watches every minute, you see the zone early: when price comes back to it, not after the move has gone. Here is that same day again, the one that took your stop, drawn with OrderBlock's rules.
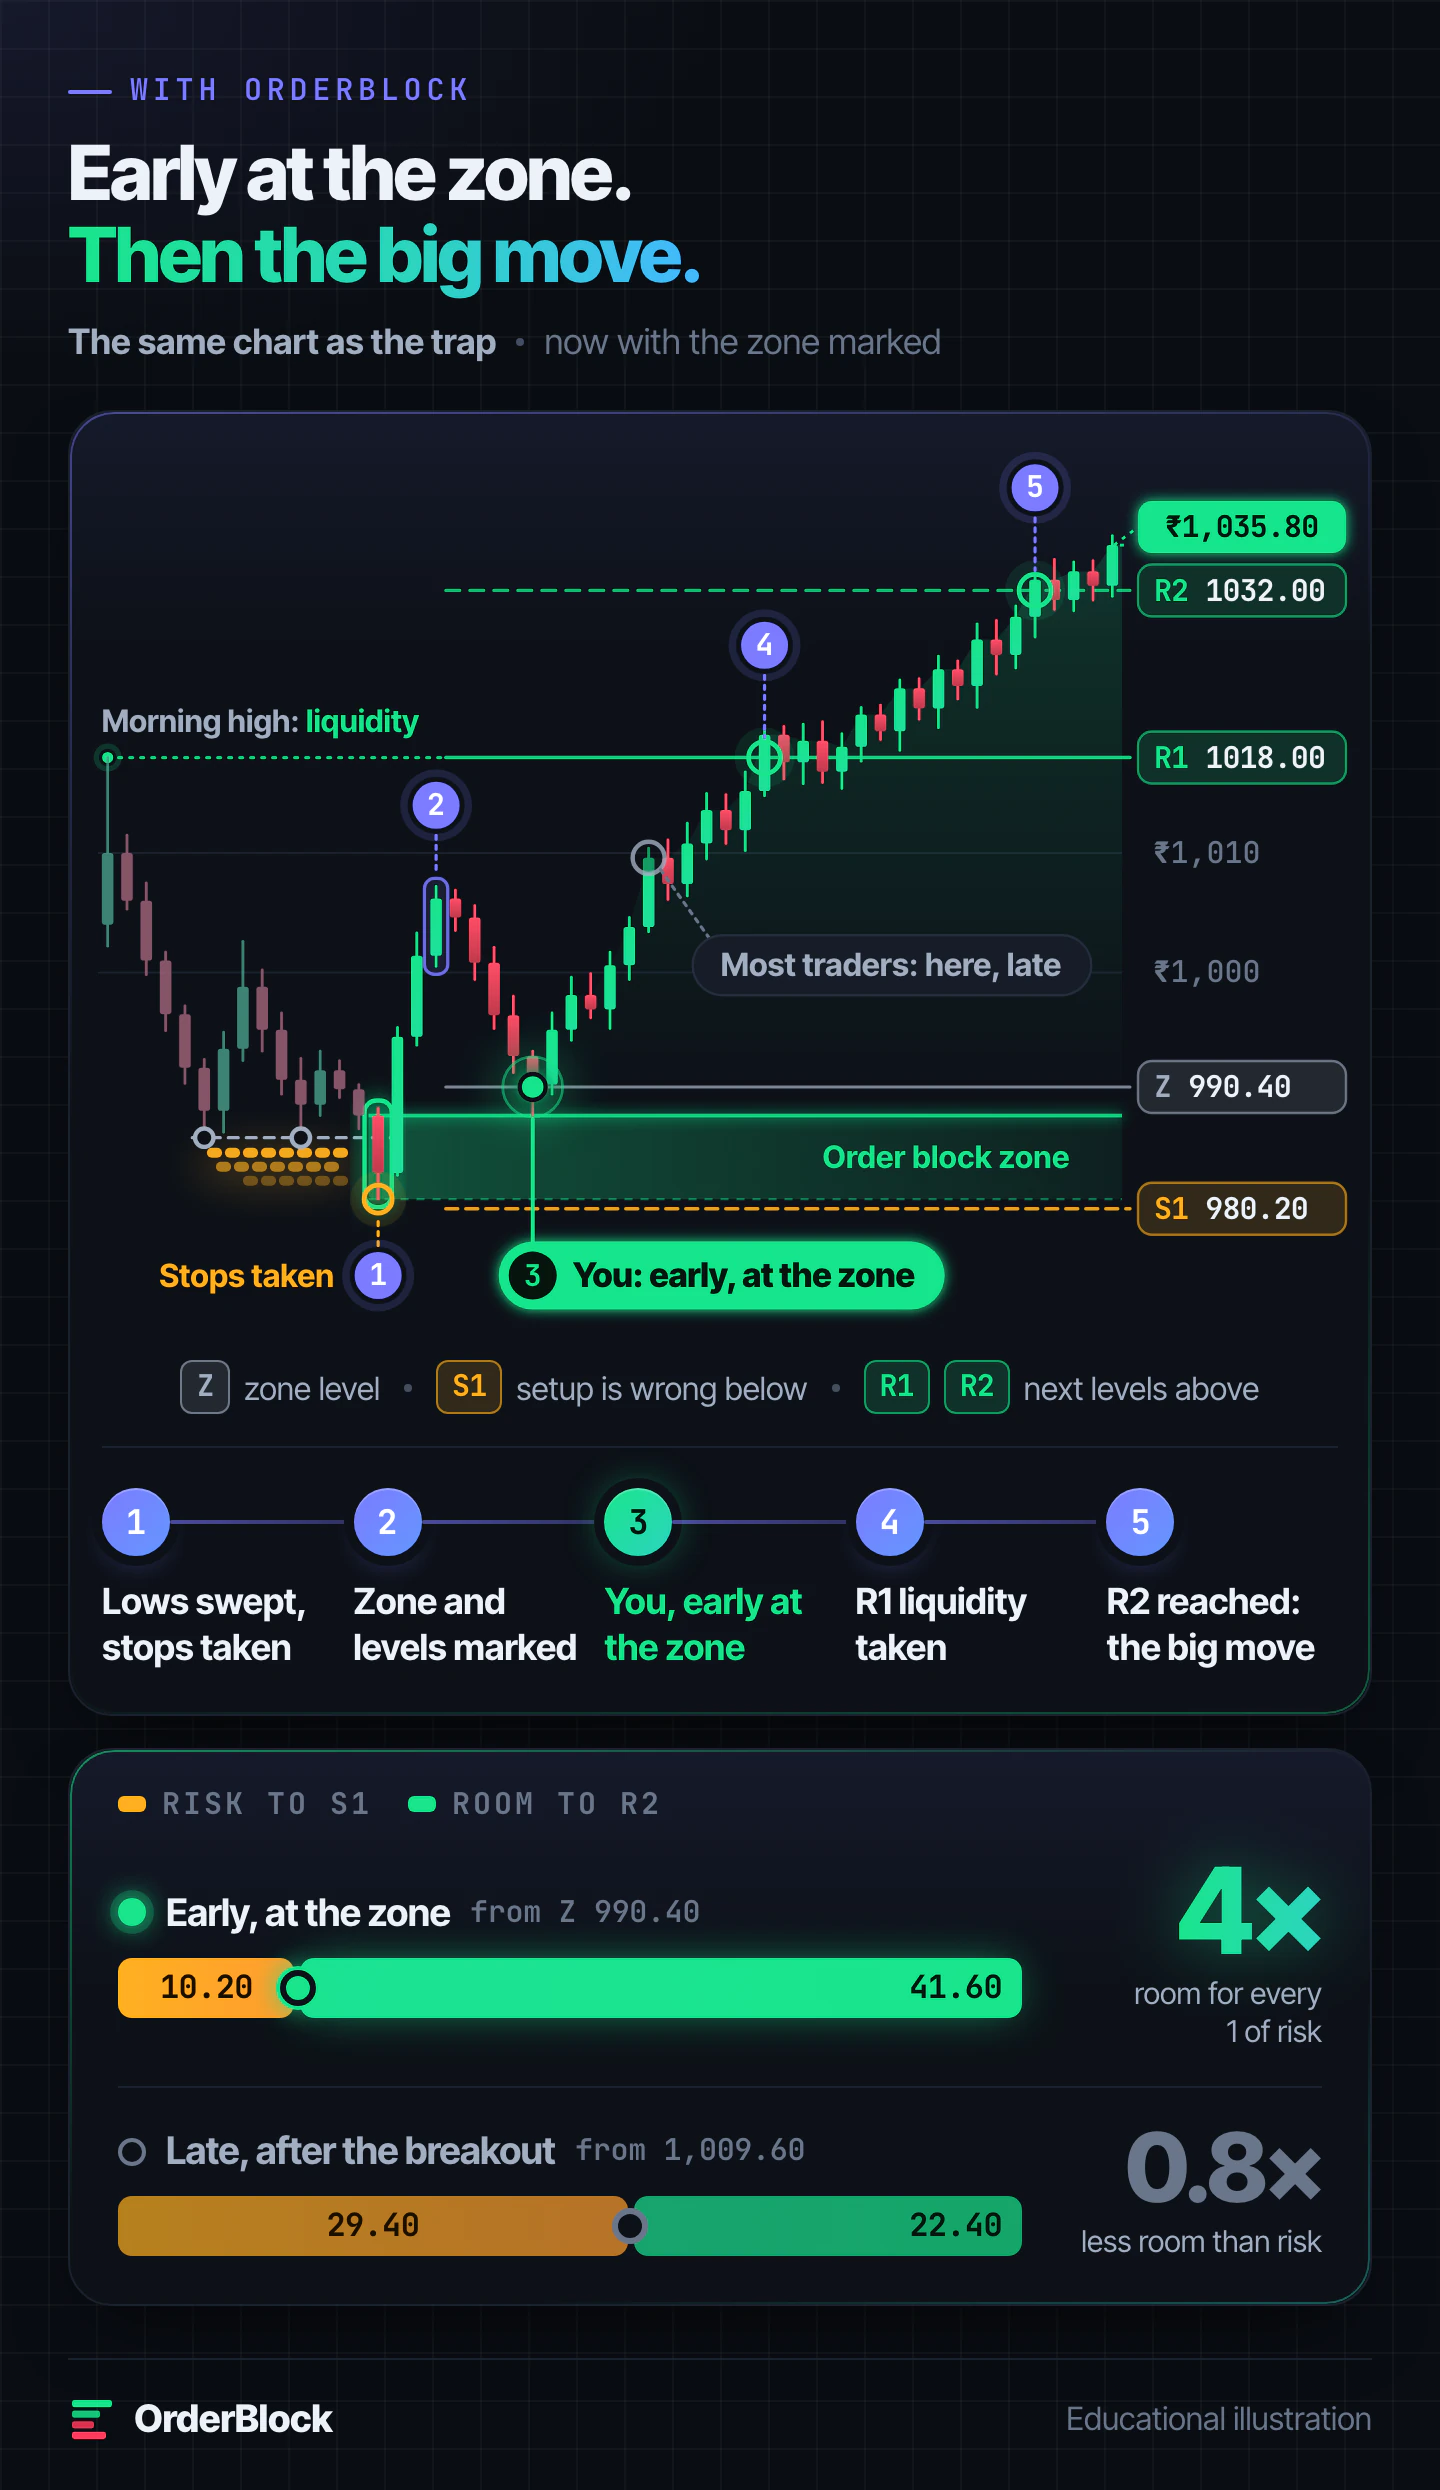
The candles didn't change, only where you stood.
What members say
The combination of liquidity zones and order blocks saves me a lot of manual chart marking. My prep is much faster and cleaner now.
Abhishek Tiwari, price action trader, Lucknow
Instead of chasing after every fast candle, I now look for quality. This tool has played a big role in building that habit.
Apoorva Naik, momentum trader, Mangaluru
The product fits Indian traders well because time is limited and the market moves fast. It helps bring structure to that chaos.
Muskaan Oberoi, options buyer, Delhi NCR
Stop being the liquidity. Be early at the zone. See plans and open the live terminal, or read more member reviews first.
A chart app vs OrderBlock
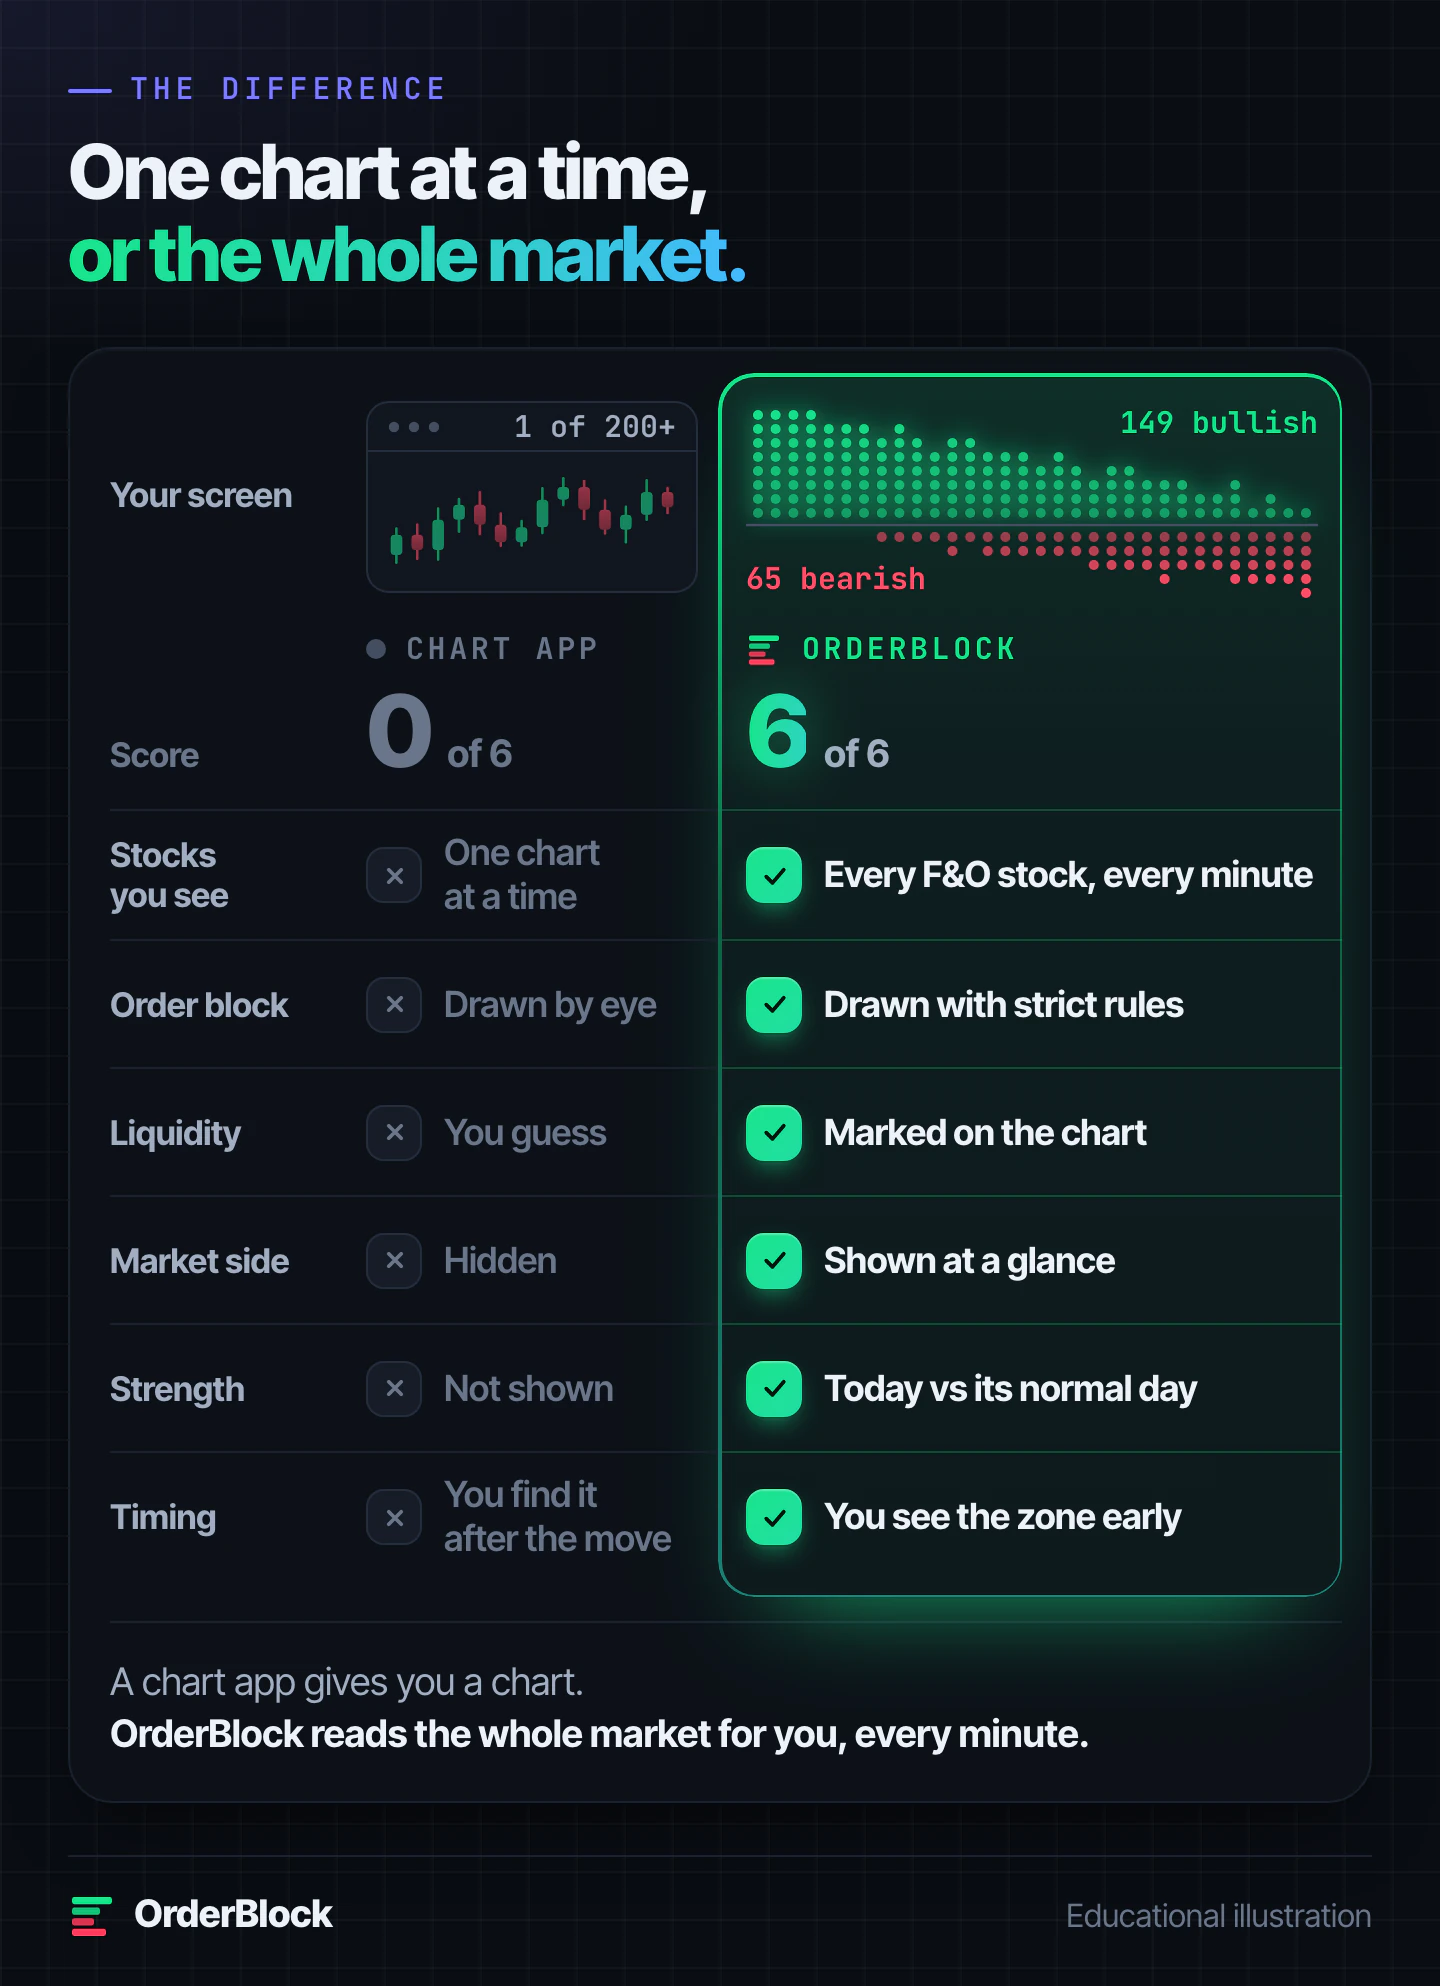
A chart app shows one stock at a time and leaves the rest to your eyes. OrderBlock reads the whole market first, then hands you the few charts worth your time, already marked. Your time goes into the decision, not the search.
Trade with the footprints, not against them
Learning what an order block is takes a few minutes. You just did it.
Seeing a real one live, on the right stock at the right moment, is a different job. It takes the whole market's data, checked every minute, with the same strict rules on every chart. That is what OrderBlock does. You still make every decision.
Next time big money leaves a zone, you can be standing at it, not stopped out under it.
See plans and open the terminal