The OrderBlock daily playbook: from 200+ stocks to one clear zone
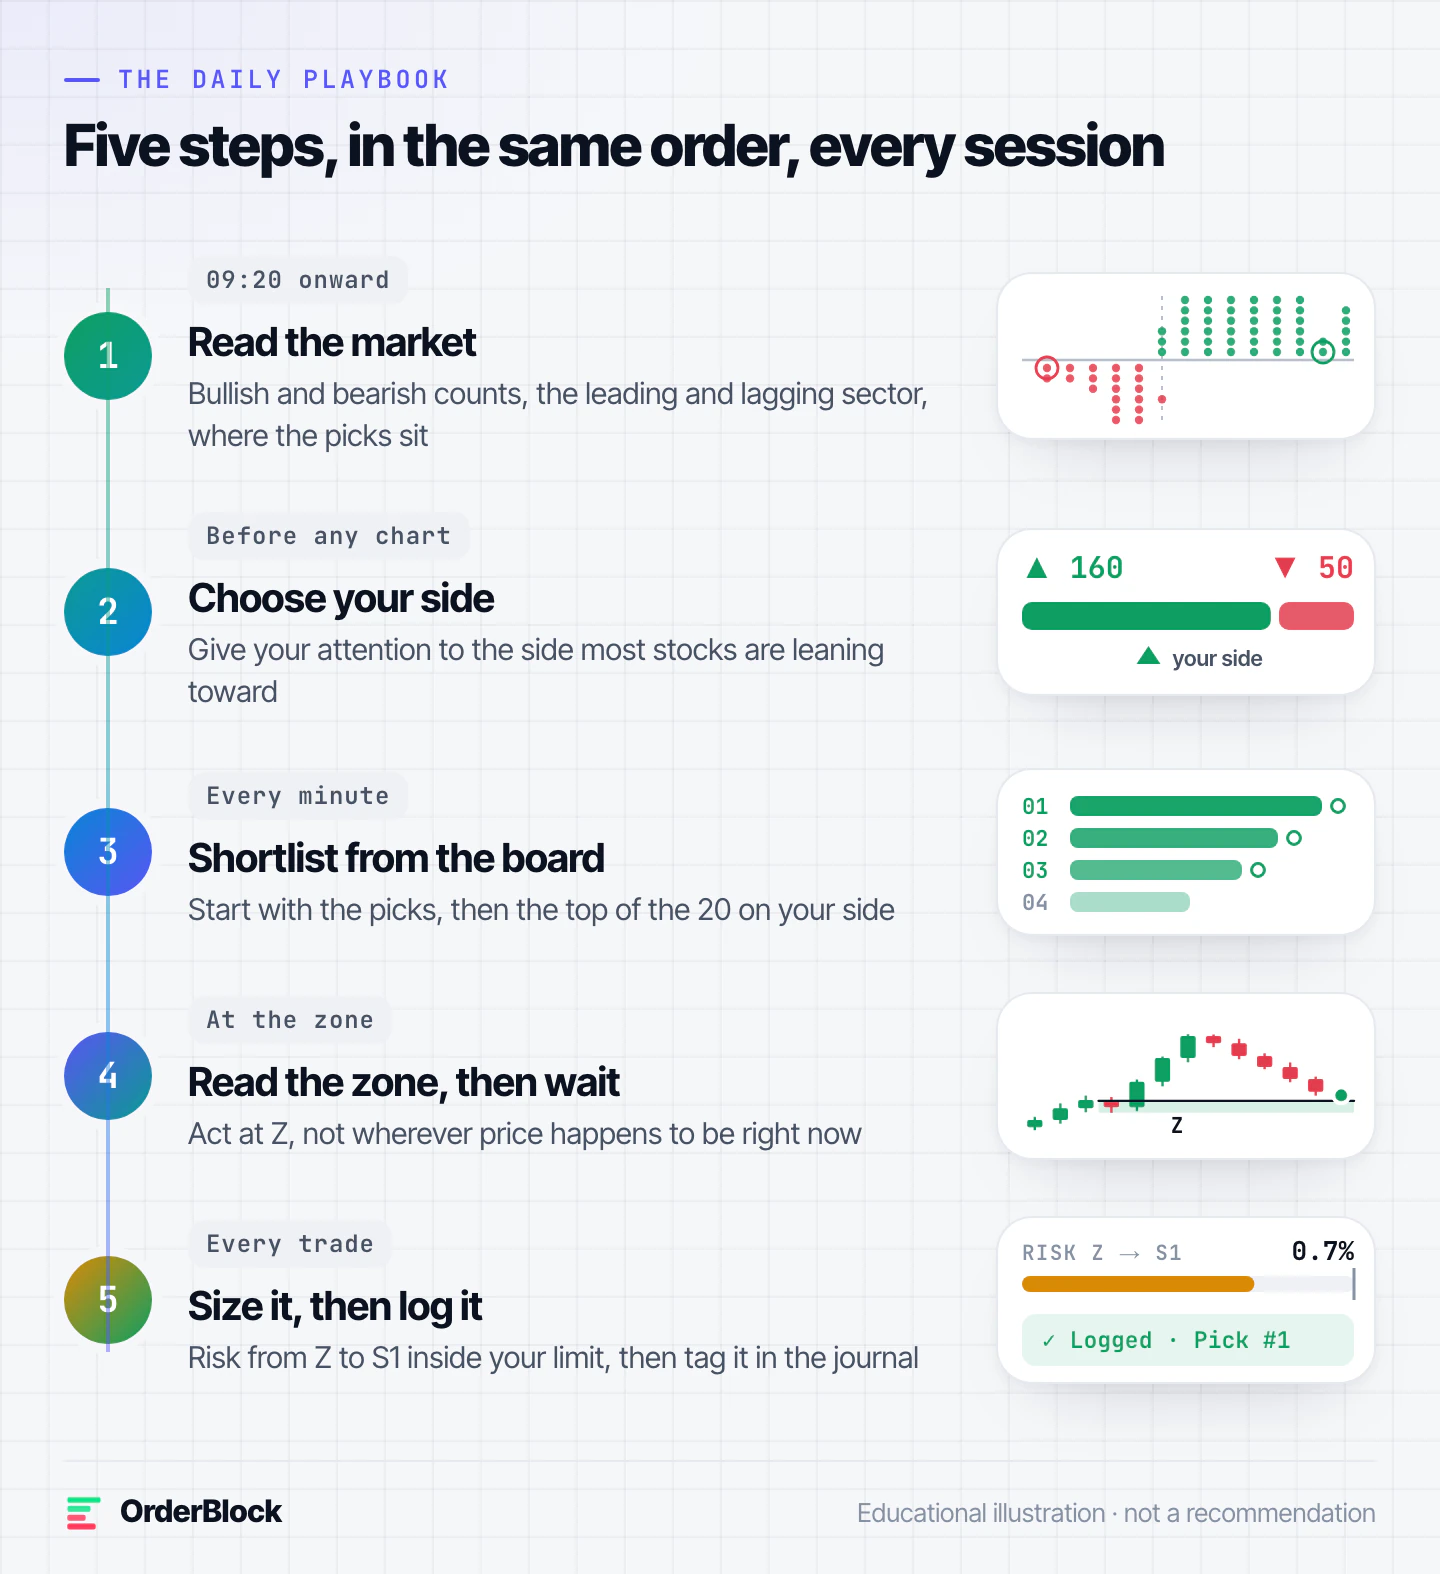
Consistent traders repeat one process. The five-step routine the terminal is built around: read the market, choose a side, shortlist from the board, wait for the zone, then size and log every trade.
Most intraday traders don't struggle for ideas. They struggle because every session starts from zero: a new stock from a group chat, a new indicator, a new reason to act. Consistency comes from the opposite habit: the same questions, in the same order, every day.
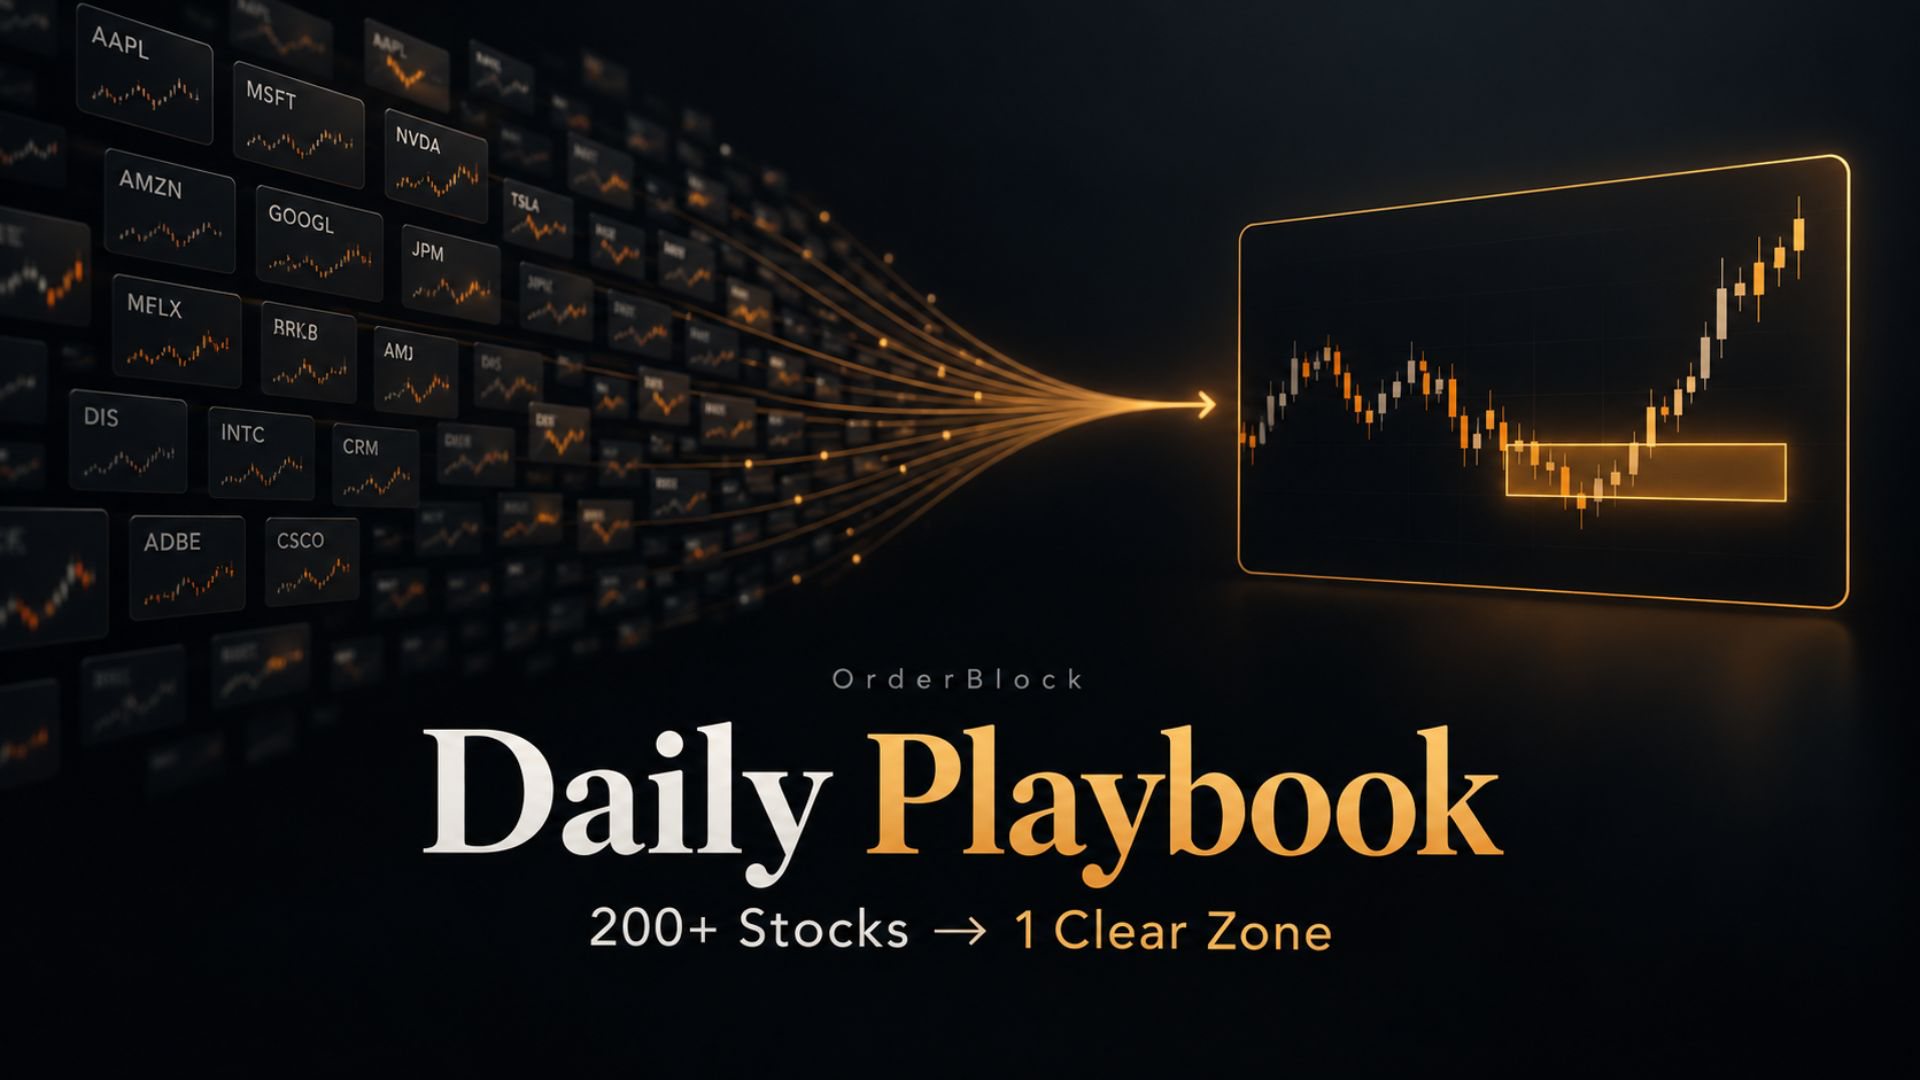
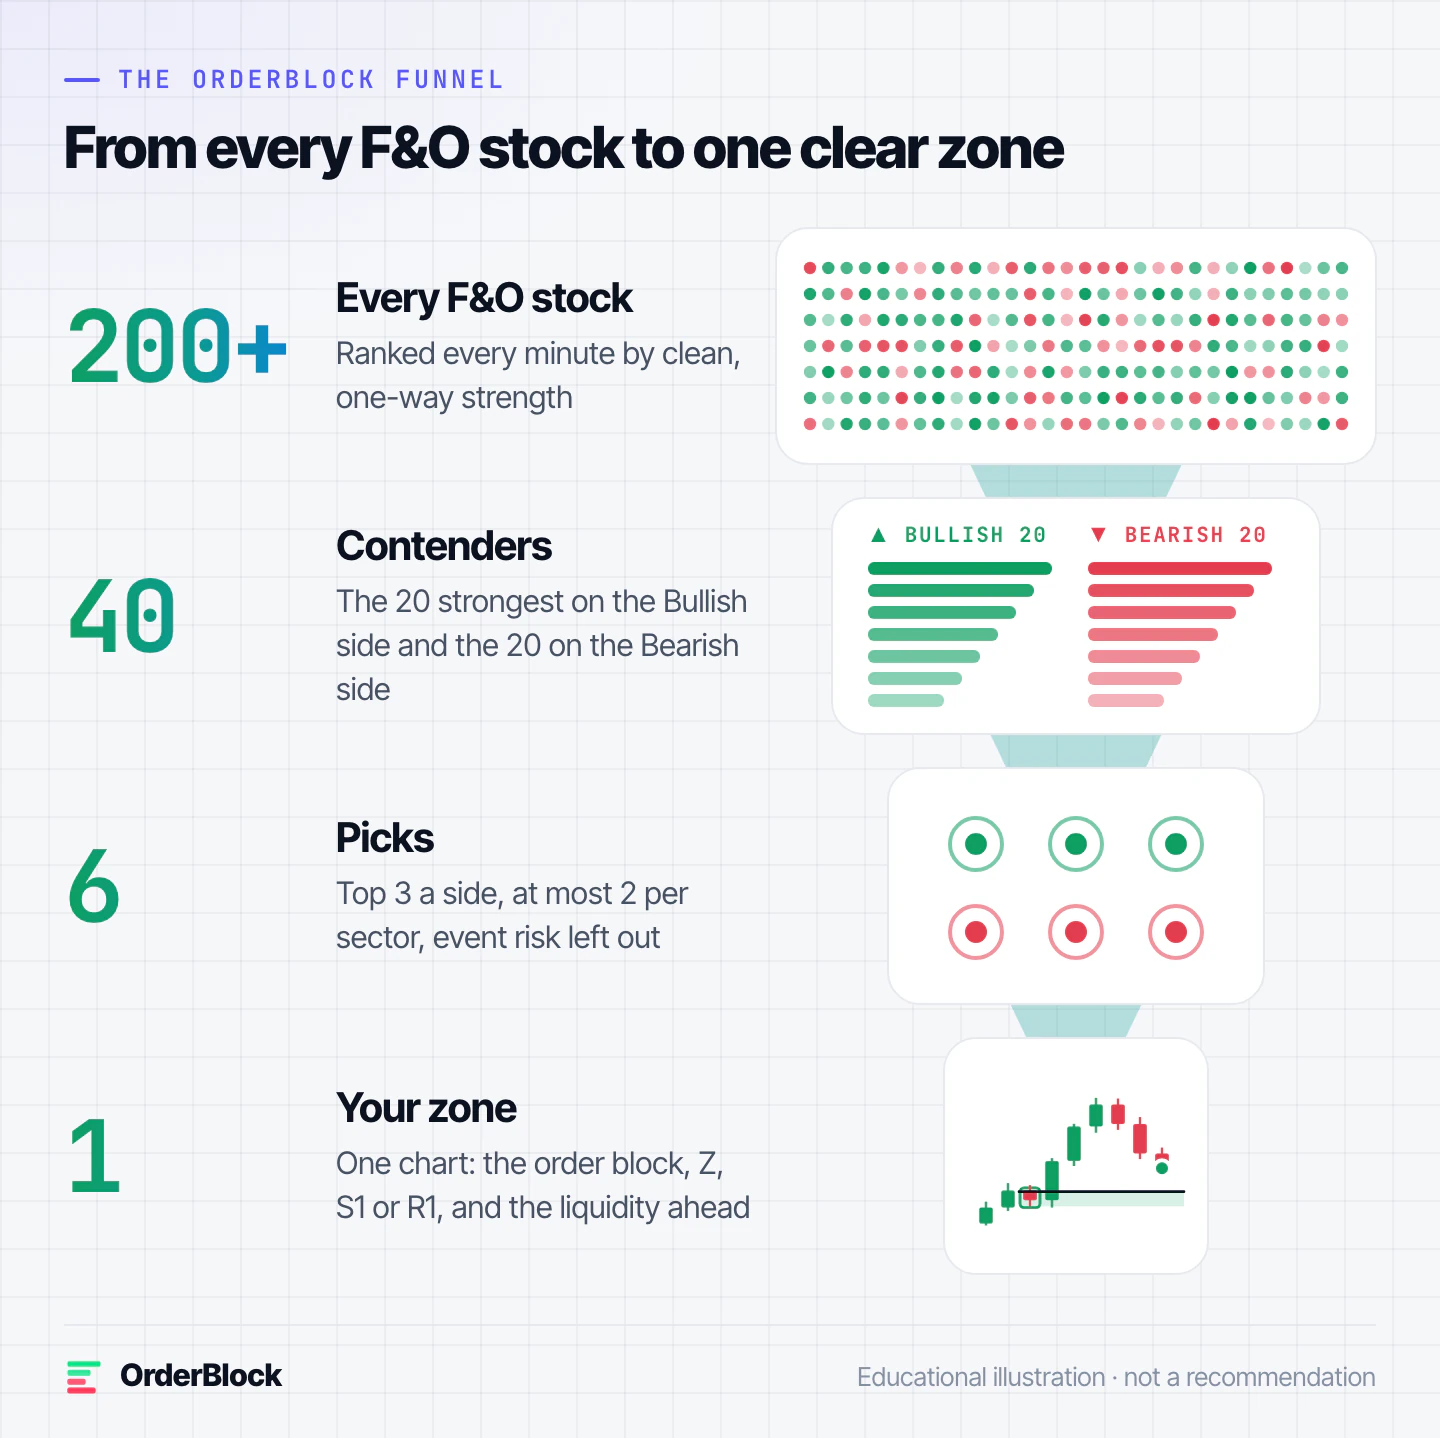
The OrderBlock terminal is laid out as that order. It starts with every F&O stock and narrows the field, minute by minute, until one chart and one zone are left. This playbook walks through it step by step.
Step 1: Read the market (from about 09:20)
The first minutes after 09:15 are driven by overnight orders and the opening auction. Direction flips often, and a stock that looks strong at 09:17 can be flat by 09:30. The board restarts its strength reading once those opening minutes pass, so what you see from about 09:20 reflects real intraday direction rather than the opening rush. Use this time to look, not to act.
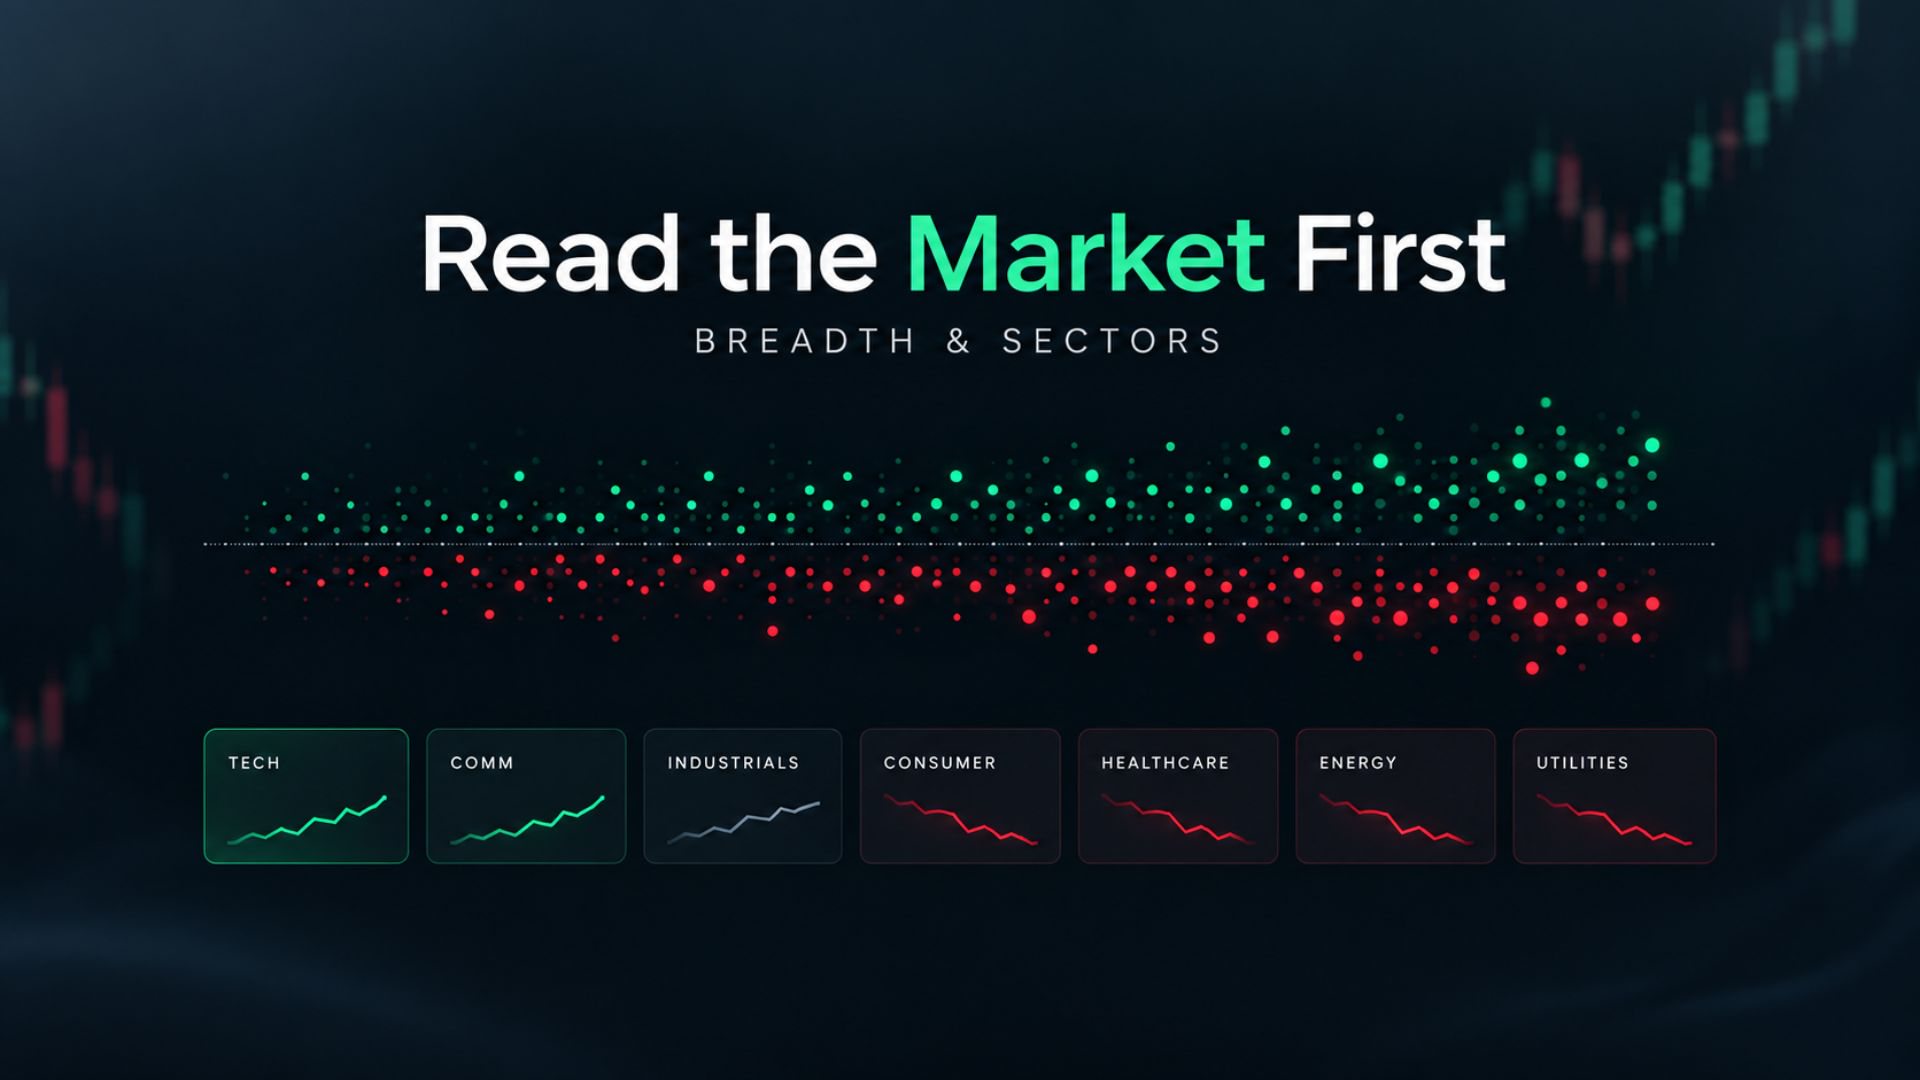
Then read the strip at the top of the terminal, the market picture. Every F&O stock is a dot at its move for the day: bullish stocks above the line, bearish stocks below it. Three things take a few seconds:
- The counts. ▲ Bullish and ▼ Bearish tell you how many stocks lean each way. 160 against 50 is a one-sided day. 105 against 105 is not.
- The leading and lagging sector. Money usually moves in baskets, and the callouts name the strongest and the weakest sector.
- The rings. The six picks are ringed, so you can see at a glance how far from zero the day's strongest stocks sit.
Step 2: Choose your side
If one side clearly dominates, spend your attention there. A bullish setup on a day when 170 stocks lean bearish is swimming against the tide. On a balanced day, expect fewer clean setups on either side and be pickier.
Decide the side before you open a single chart. It takes half the market off your screen.
Step 3: Shortlist from the board
Each side of the board shows its 20 strongest stocks, ranked every minute by clean, one-directional strength. A stock that ran up and came straight back down doesn't make the list, however big its range.
At the top of each side sit the picks: the three strongest stocks, with no more than two from one sector and any stock marked as event risk left out. Start there. The RULE row in each popup tells you why a stock is or isn't a pick, so you never have to guess.
Step 4: Read the zone, then wait for it
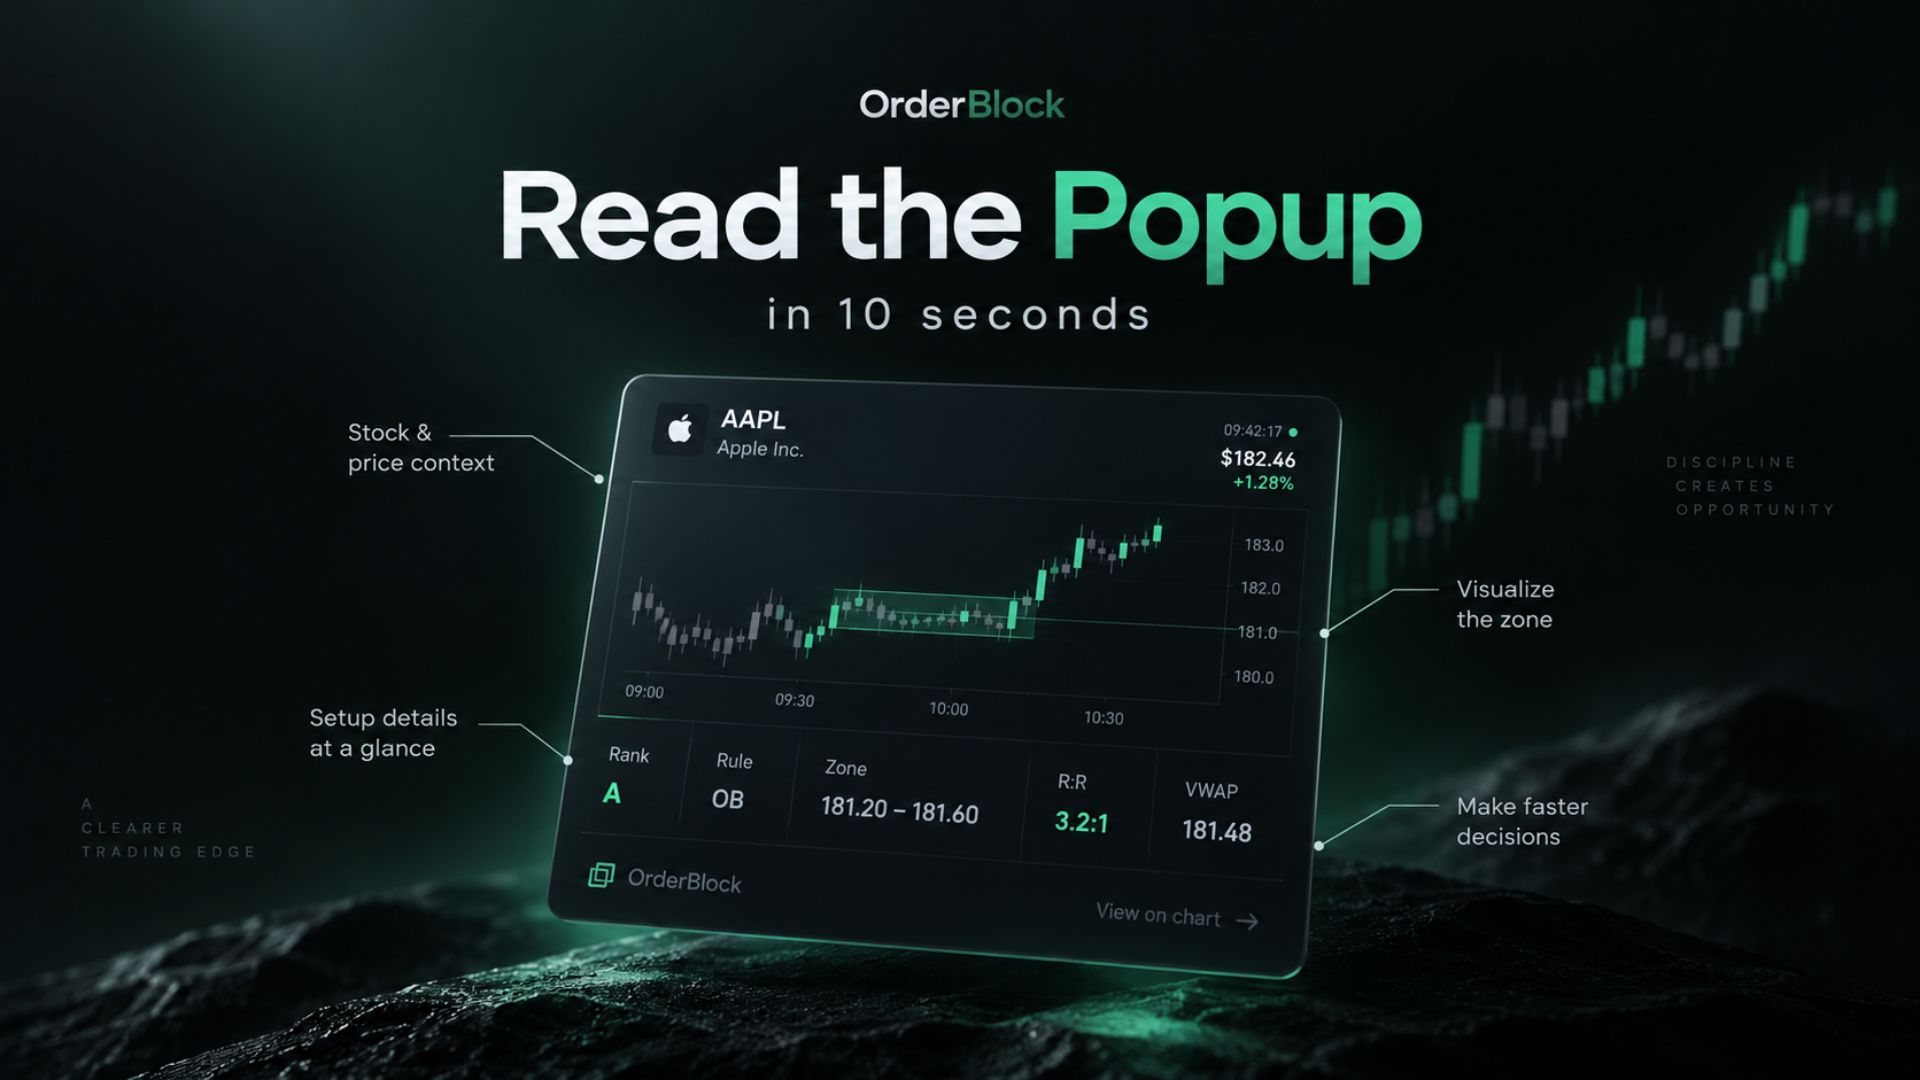
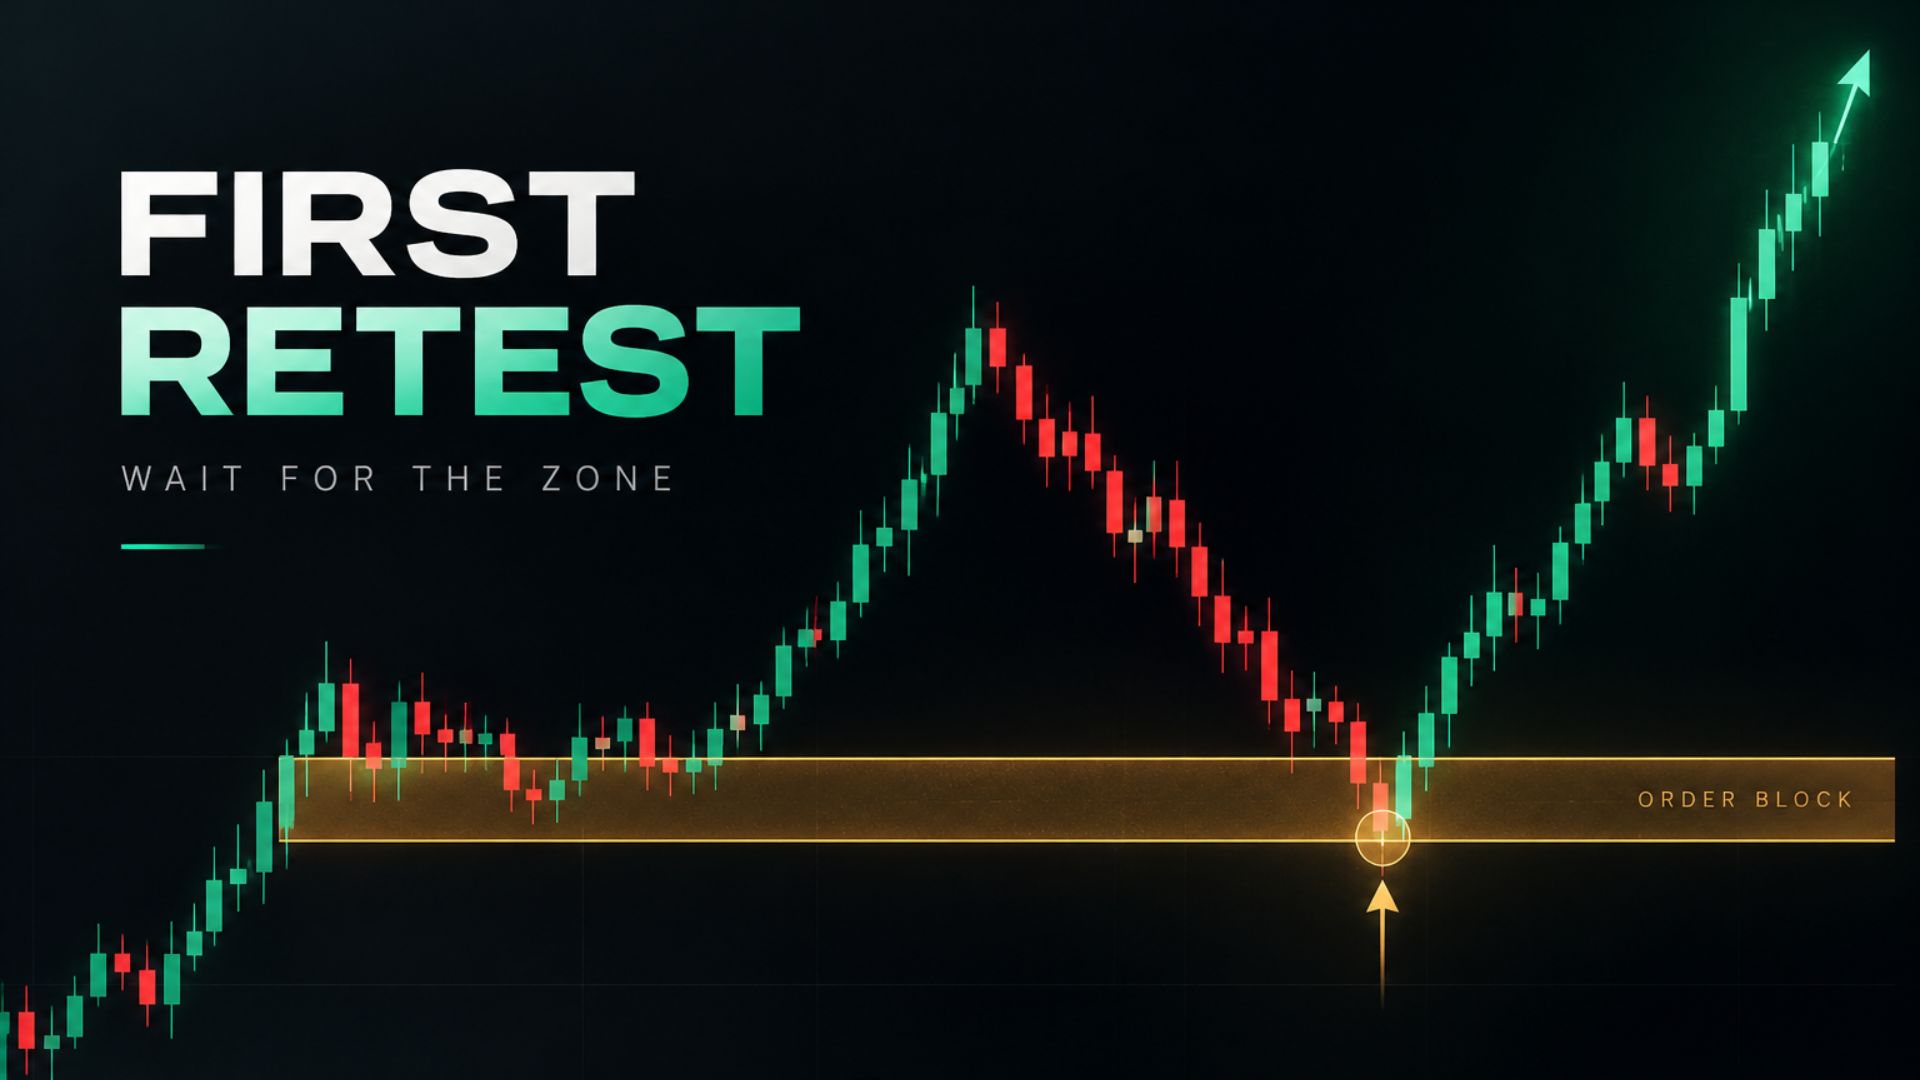
Open the popup. The chart shows the order block (the last opposite candle before the move that broke structure), the zone level Z, the level where the setup is wrong (S1 on bullish charts, R1 on bearish ones) and the liquidity levels in the direction of the move.
The habit that matters most: the zone is where you act, not wherever price happens to be. If price is far from Z, the right move is usually to wait. Let the zone come to you shows why, with numbers.
Step 5: Size it, then log it
Before acting, work out the rupee risk: the distance from Z to S1 (or R1), times your quantity. Keep it inside a fixed slice of your capital, and 1% is a common ceiling. If the distance is too wide for your account, go smaller or skip it. Then log the trade in the Trading journal with its setup, so a month from now you know which setups actually work for you.
What a good day looks like
A good day on this playbook is often a quiet one: one to three trades, each at a zone, each sized the same way, each written down. Some days the right number is zero. The board refreshes every minute until 15:30, so there is never a reason to force it.
Keep this checklist next to your screen:
- Have I read the counts and the sectors?
- Have I chosen a side?
- Is this stock near the top of that side?
- Is price at the zone, not far from it?
- Is my risk from Z to S1 (or R1) inside my limit?
Five yeses, and you have a plan. Anything less, and you have a feeling.
Read next
- How to read an Order Block popup in 10 seconds
- Read the market before the stock: breadth, sectors and the market picture
OrderBlock is a market data and analytics tool. This post is for education only. It is not investment advice or a recommendation to buy or sell any security, and its examples use sample numbers. Trading in F&O involves substantial risk.