Let the zone come to you: patience, timing and the first retest
Chasing a strong stock can turn a 1 : 2.7 setup into 1 : 0.4. Why the zone is where you act, how a zone ages, and how to judge it on 5-minute closes.
You open the board at 10:40. The top bullish stock is up 3% and still climbing. Every instinct says act now, before it runs away without you. It is one of the most expensive habits in intraday trading, and the popup's own levels show exactly why.
Same setup, two very different trades
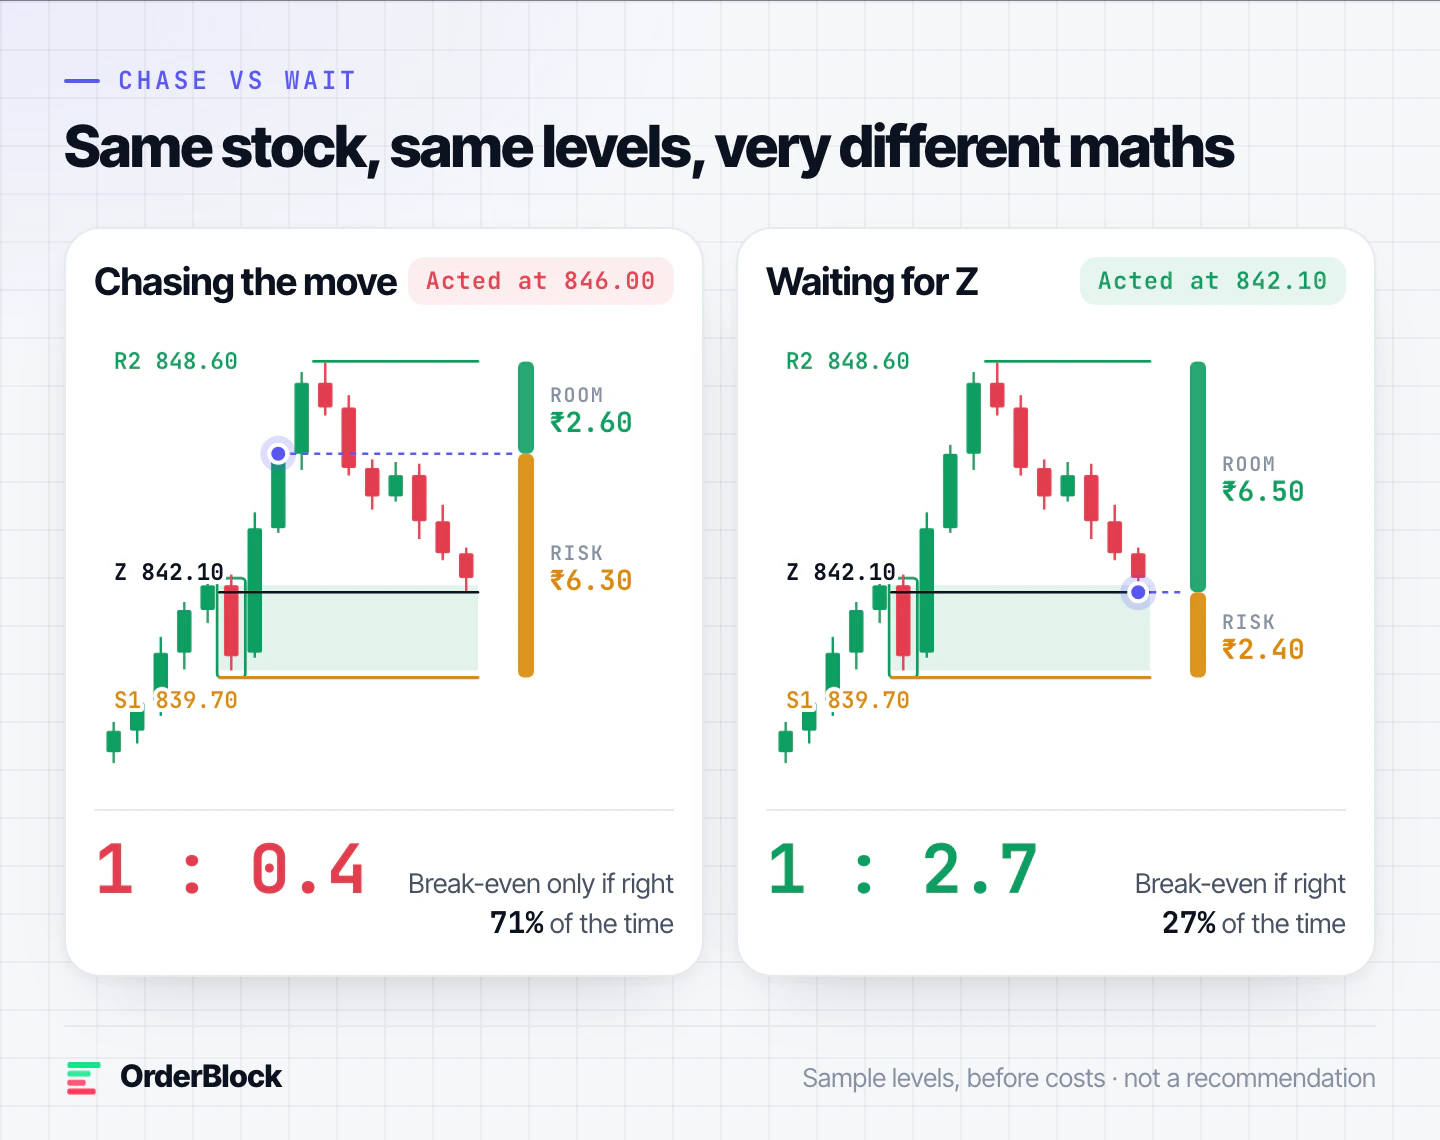
Take a sample bullish setup: zone level Z at ₹842.10, the level where the setup is wrong (S1) at ₹839.70, and the second resistance R2 at ₹848.60.
- Chasing at ₹846.00: you risk ₹6.30 per share for ₹2.60 of room before R2. That's 1 : 0.4. To break even, you would need to be right about 71% of the time.
- Waiting for ₹842.10: the same levels now give ₹2.40 of risk for ₹6.50 of room. That's 1 : 2.7, and the break-even point drops to about 27%.
The stock, the day and the levels are identical. Only the price you acted at changed. Chasing doesn't just feel worse. It makes the maths worse.
Strength tells you where to look. The zone tells you when.
How a zone ages
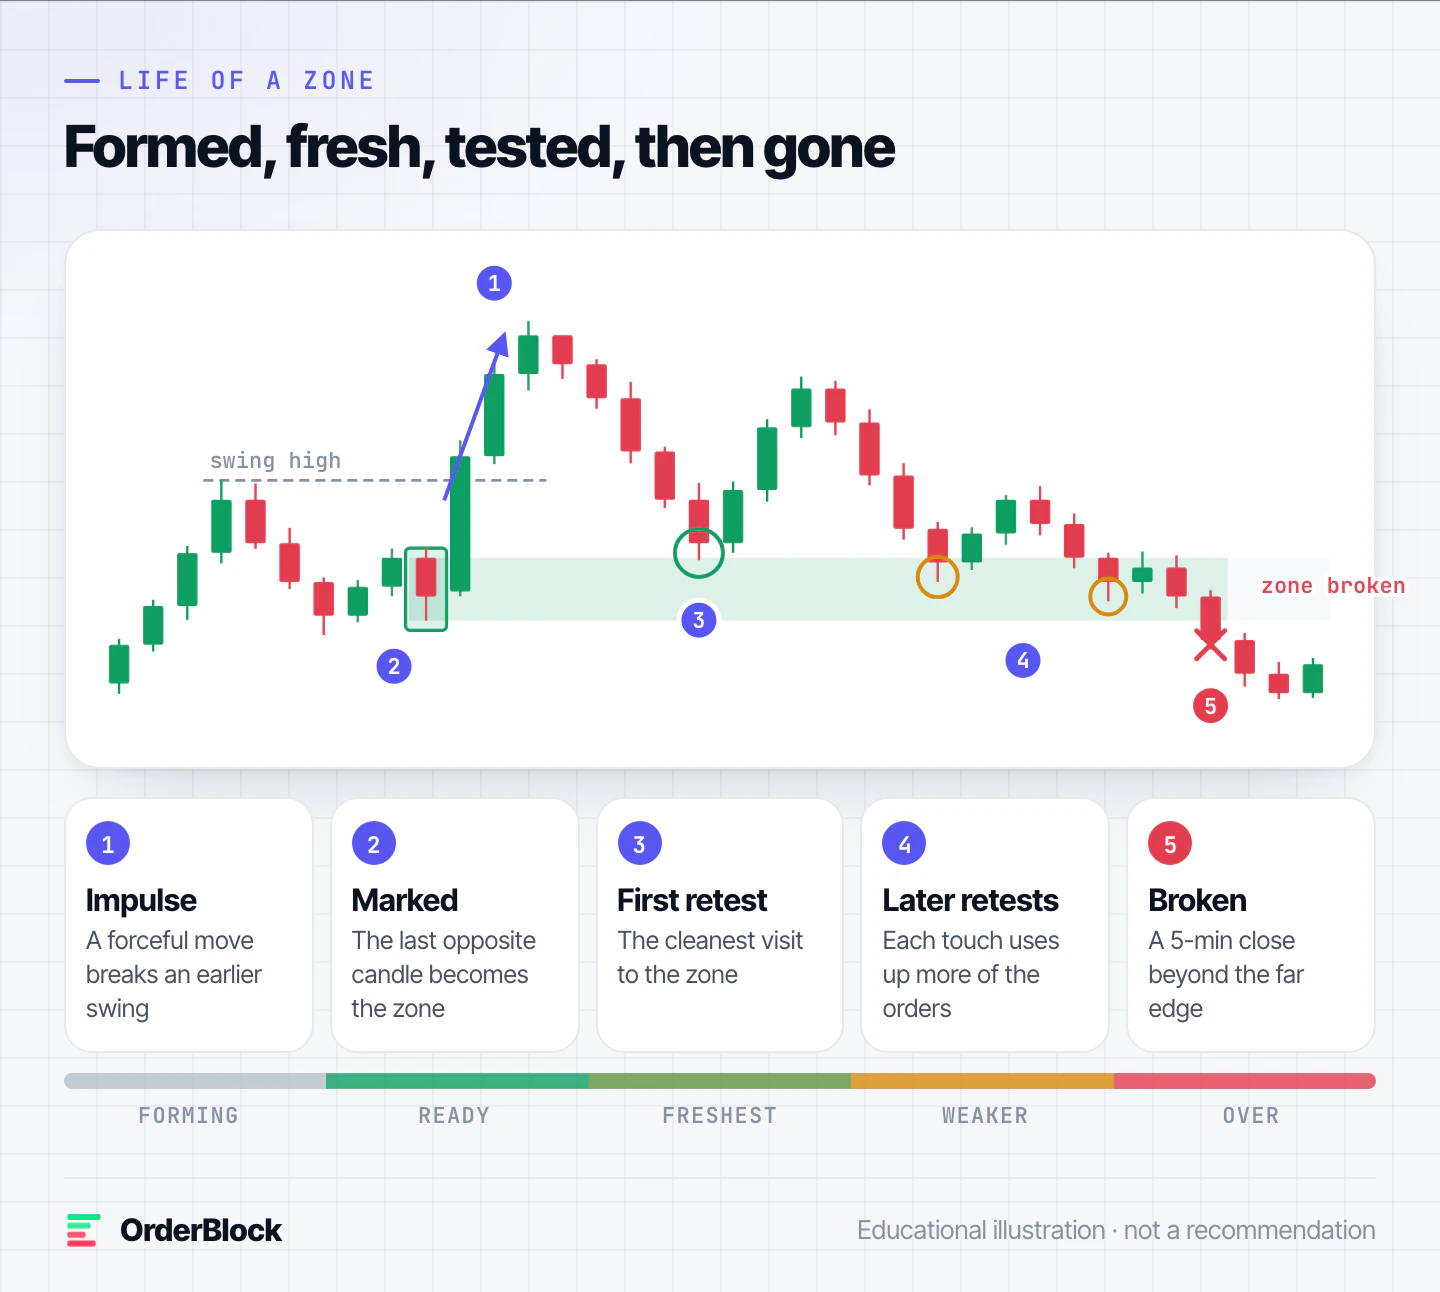
- Impulse. Price leaves a base with force and breaks structure: it closes beyond an earlier swing or beyond the range of the first 15 minutes. A slow drift doesn't count. The move has to leave a gap or travel further than a normal candle.
- Marked. The last opposite candle before that impulse becomes the order block, and the zone is drawn from it.
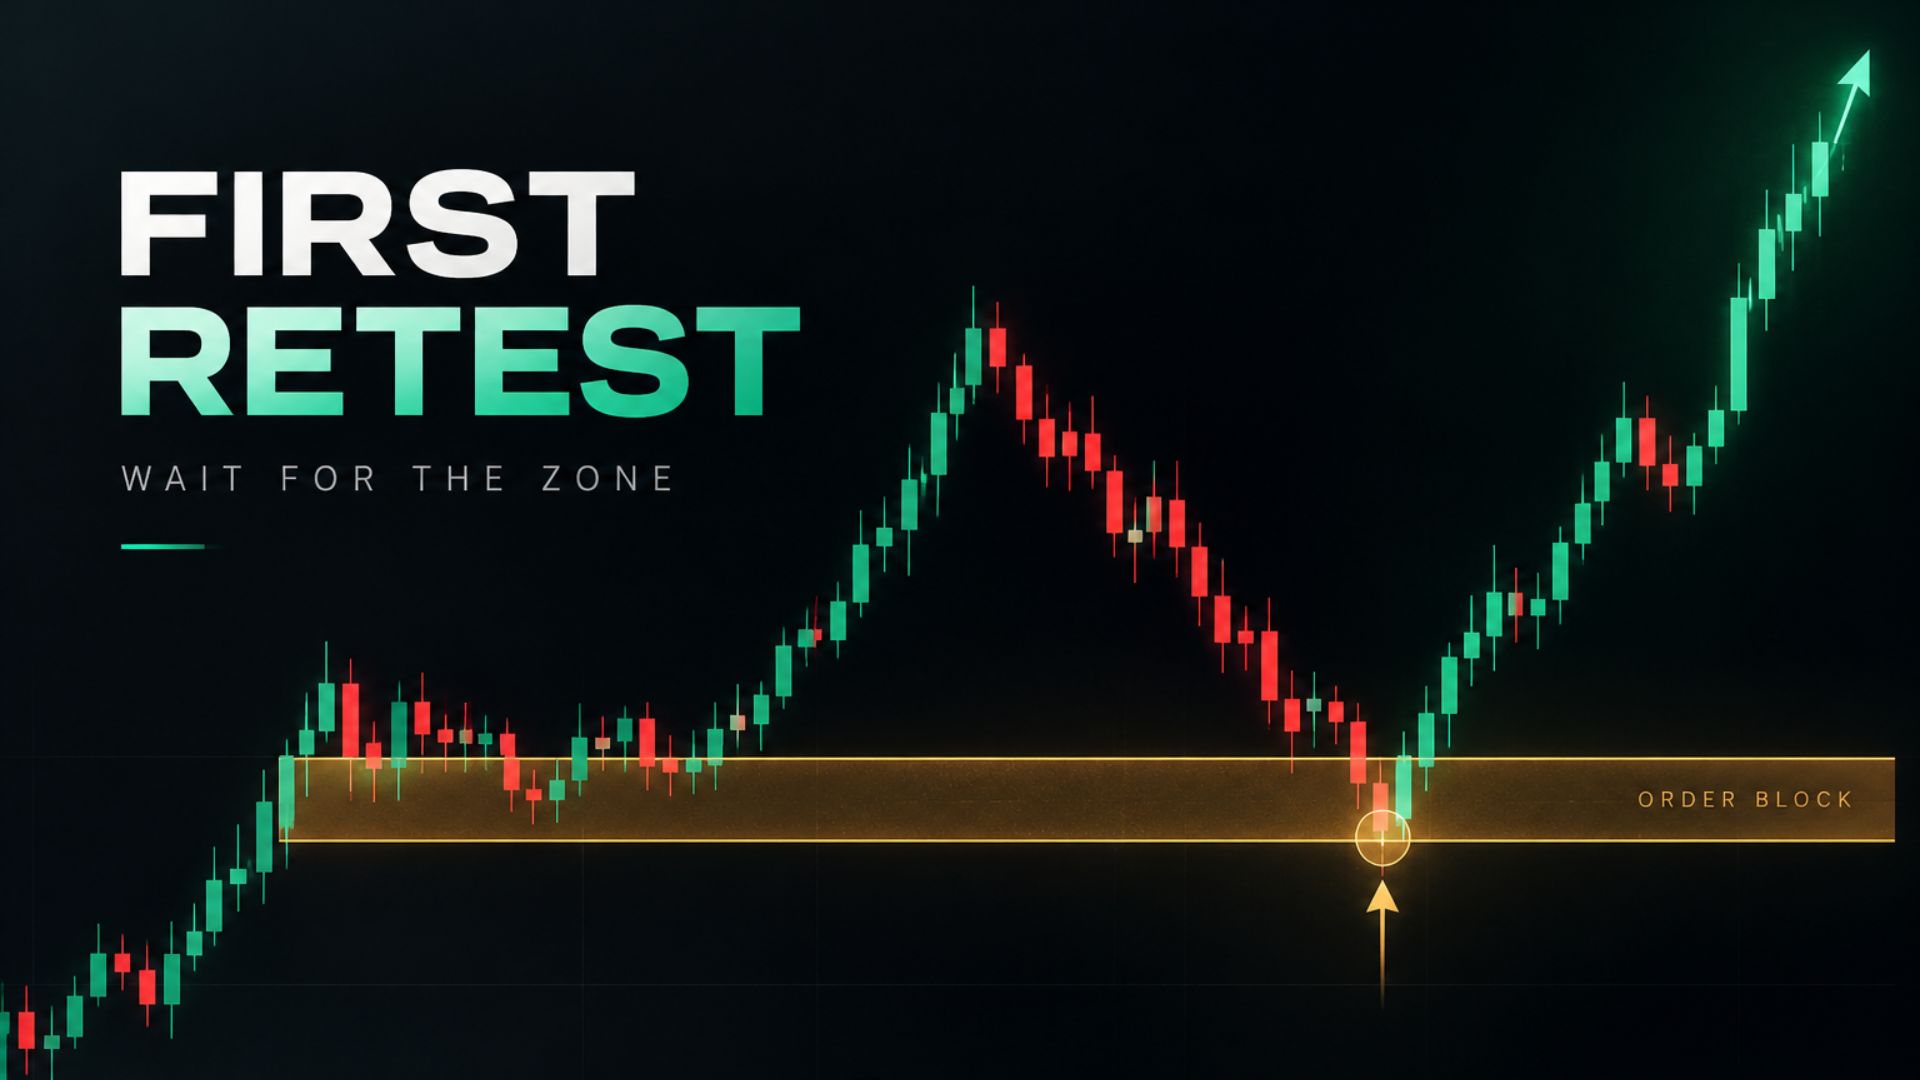
- First retest. Price comes back to the zone for the first time. Traders who work with order blocks generally see this as the cleanest visit, because the orders that started the move may still be waiting there.
- Later retests. Each visit uses up some of those orders, so the third touch is weaker than the first. Be more selective every time.
- Broken. A finished 5-minute candle closes beyond the far edge of the block, and the setup is over. The terminal moves on to the next intact block and leaves the old one on the chart, unlabelled, where it happened.
Judge the zone on 5-minute closes
The terminal builds its order blocks from finished 5-minute candles, so levels change at most once every five minutes. A wick through the zone in the middle of a candle is not a break. Price often probes a zone before turning, and what counts is where the candle closes.
- Judge the zone on candle closes, not on a single tick.
- If price is far from Z, note the zone and move on to the next popup. You don't need to watch it climb.
- If the zone breaks before price ever comes back to it, let it go. There will be another setup.
The rhythm of a session
Zones form and get tested all day, but not evenly:
- 09:15–09:20: opening noise. The board restarts its strength reading once it passes.
- 09:20–11:30: usually the busiest stretch, with fresh impulses, fresh blocks and first retests.
- 11:30–13:30: often slower. Ranges tighten and retests can drift. A good time to look at the market picture again.
- 13:30–15:00: participation often returns, and new blocks can form as the afternoon trend develops.
- After 15:00: intraday positions get squared off across the market, which can move prices regardless of structure. Many traders stop opening new positions here.
Patience is a position
Waiting isn't doing nothing. Every minute you don't chase, the terminal is re-ranking every stock and redrawing zones. When price does come back to a strong stock's zone, you will be ready, with the risk already measured.
Read next
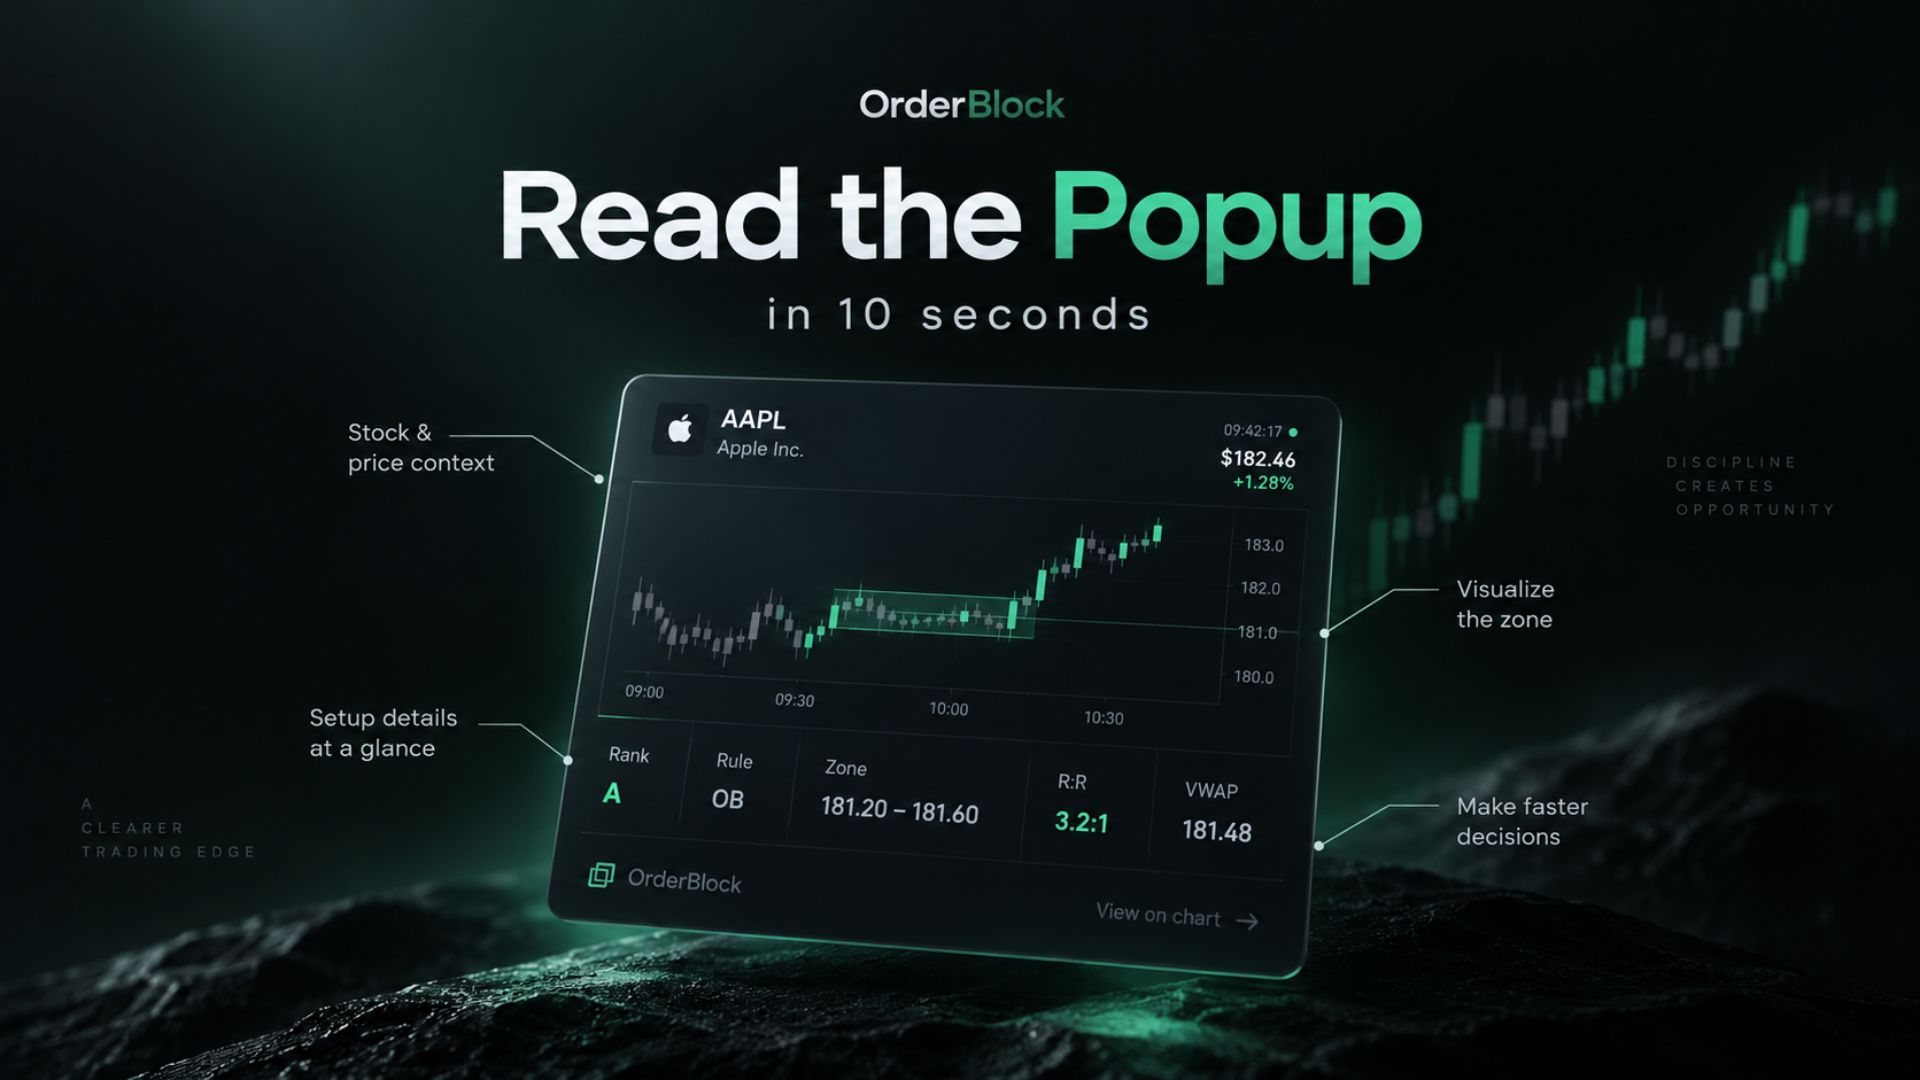
- How to read an Order Block popup in 10 seconds
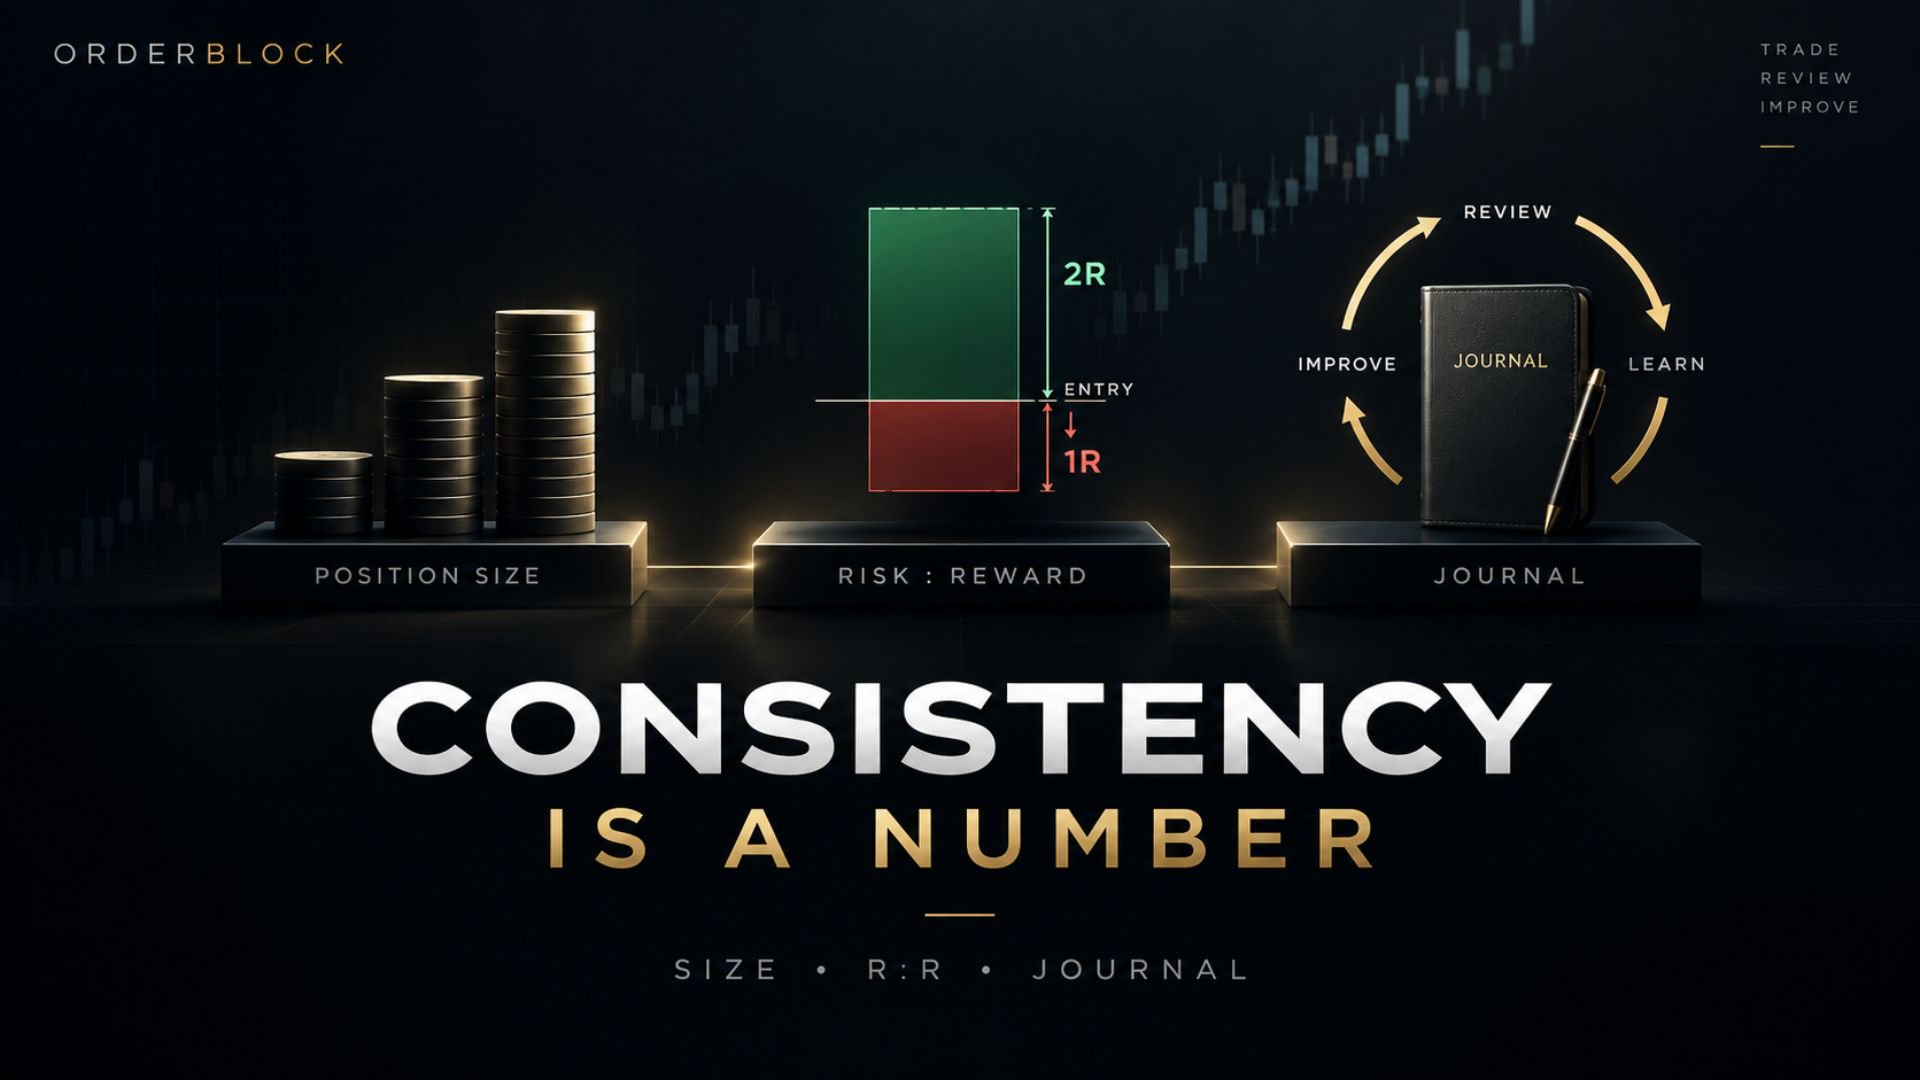
- Consistency is a number: position sizing, R:R and the journal loop
OrderBlock is a market data and analytics tool. This post is for education only. It is not investment advice or a recommendation to buy or sell any security, and its examples use sample numbers. Trading in F&O involves substantial risk.