How to read an Order Block popup in 10 seconds
Rank, rule, zone, the level where the setup is wrong, liquidity and R:R. What every row and line in the popup means, and the order to read them in.
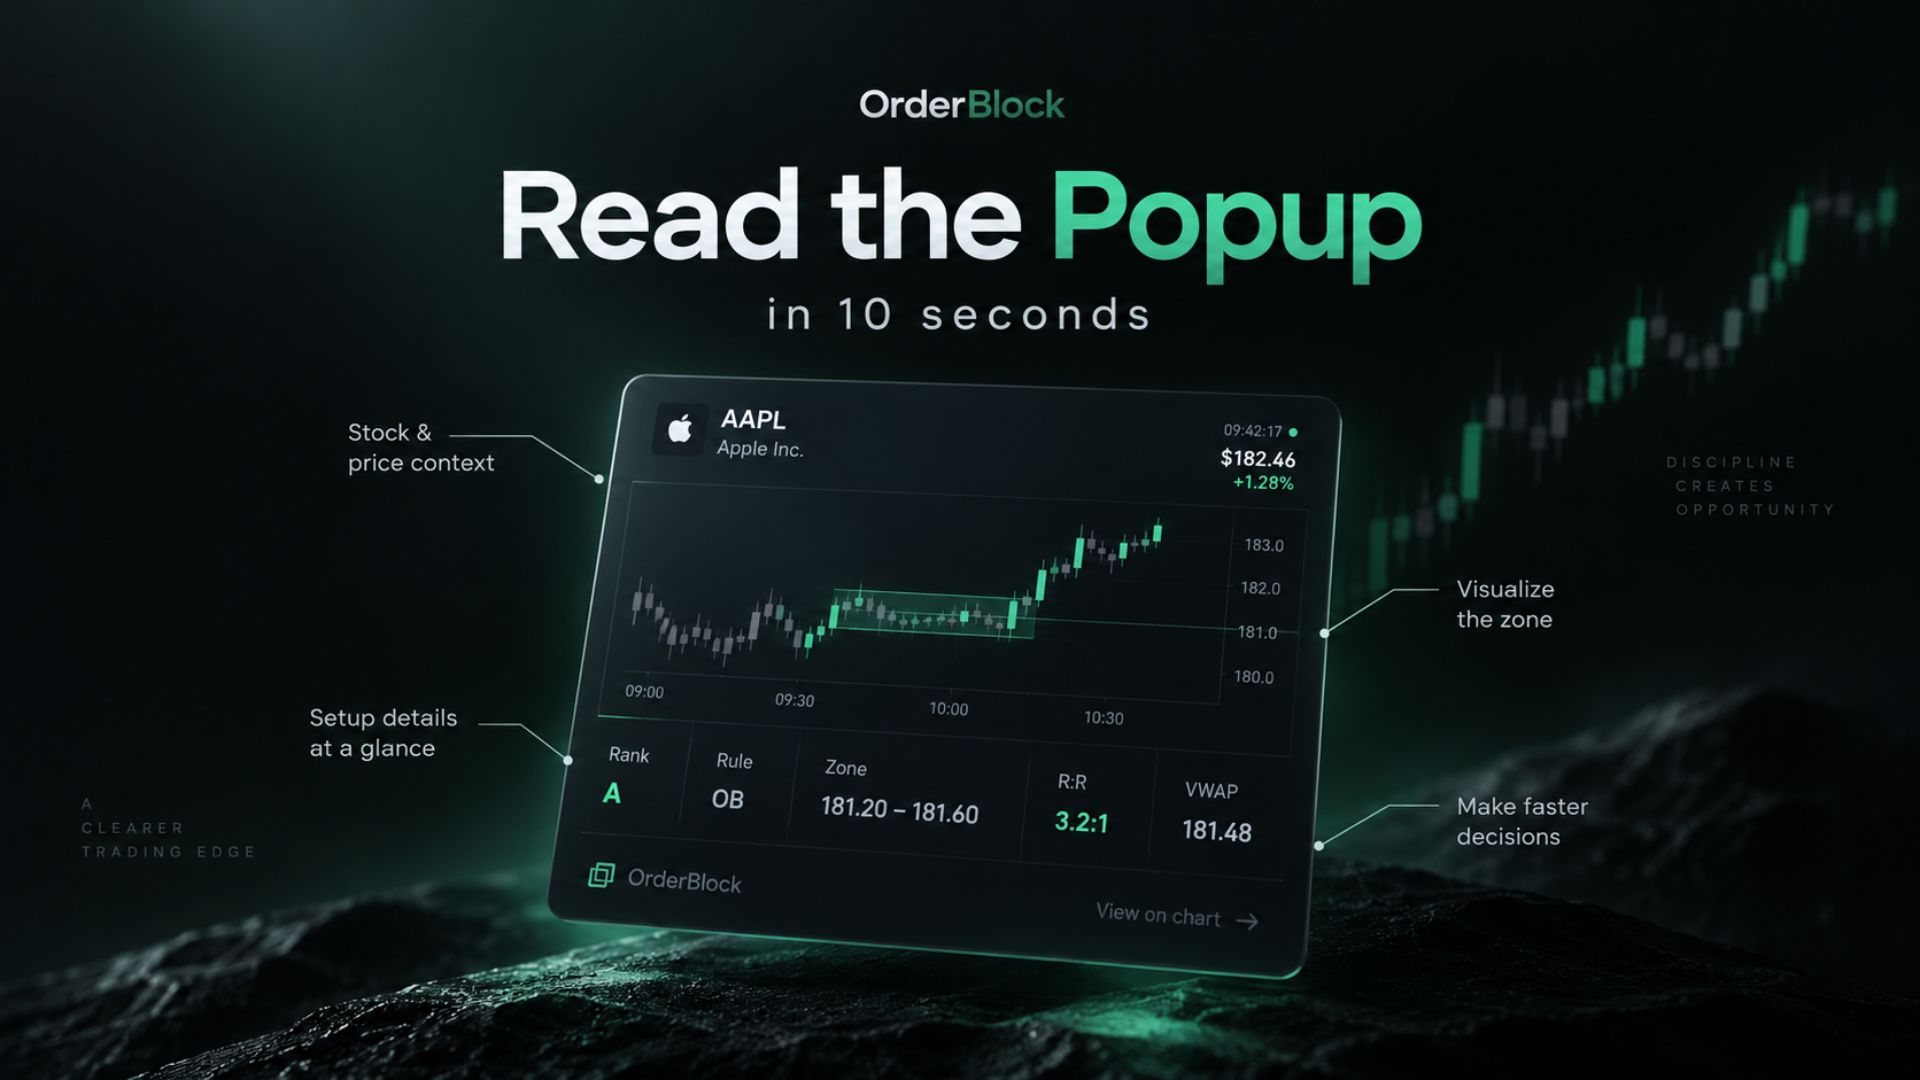
Tap any stock on the board and a popup opens: a chart and a stack of numbers. It looks dense the first time. After a week it takes ten seconds, because every row answers one question you would otherwise have to work out by hand.
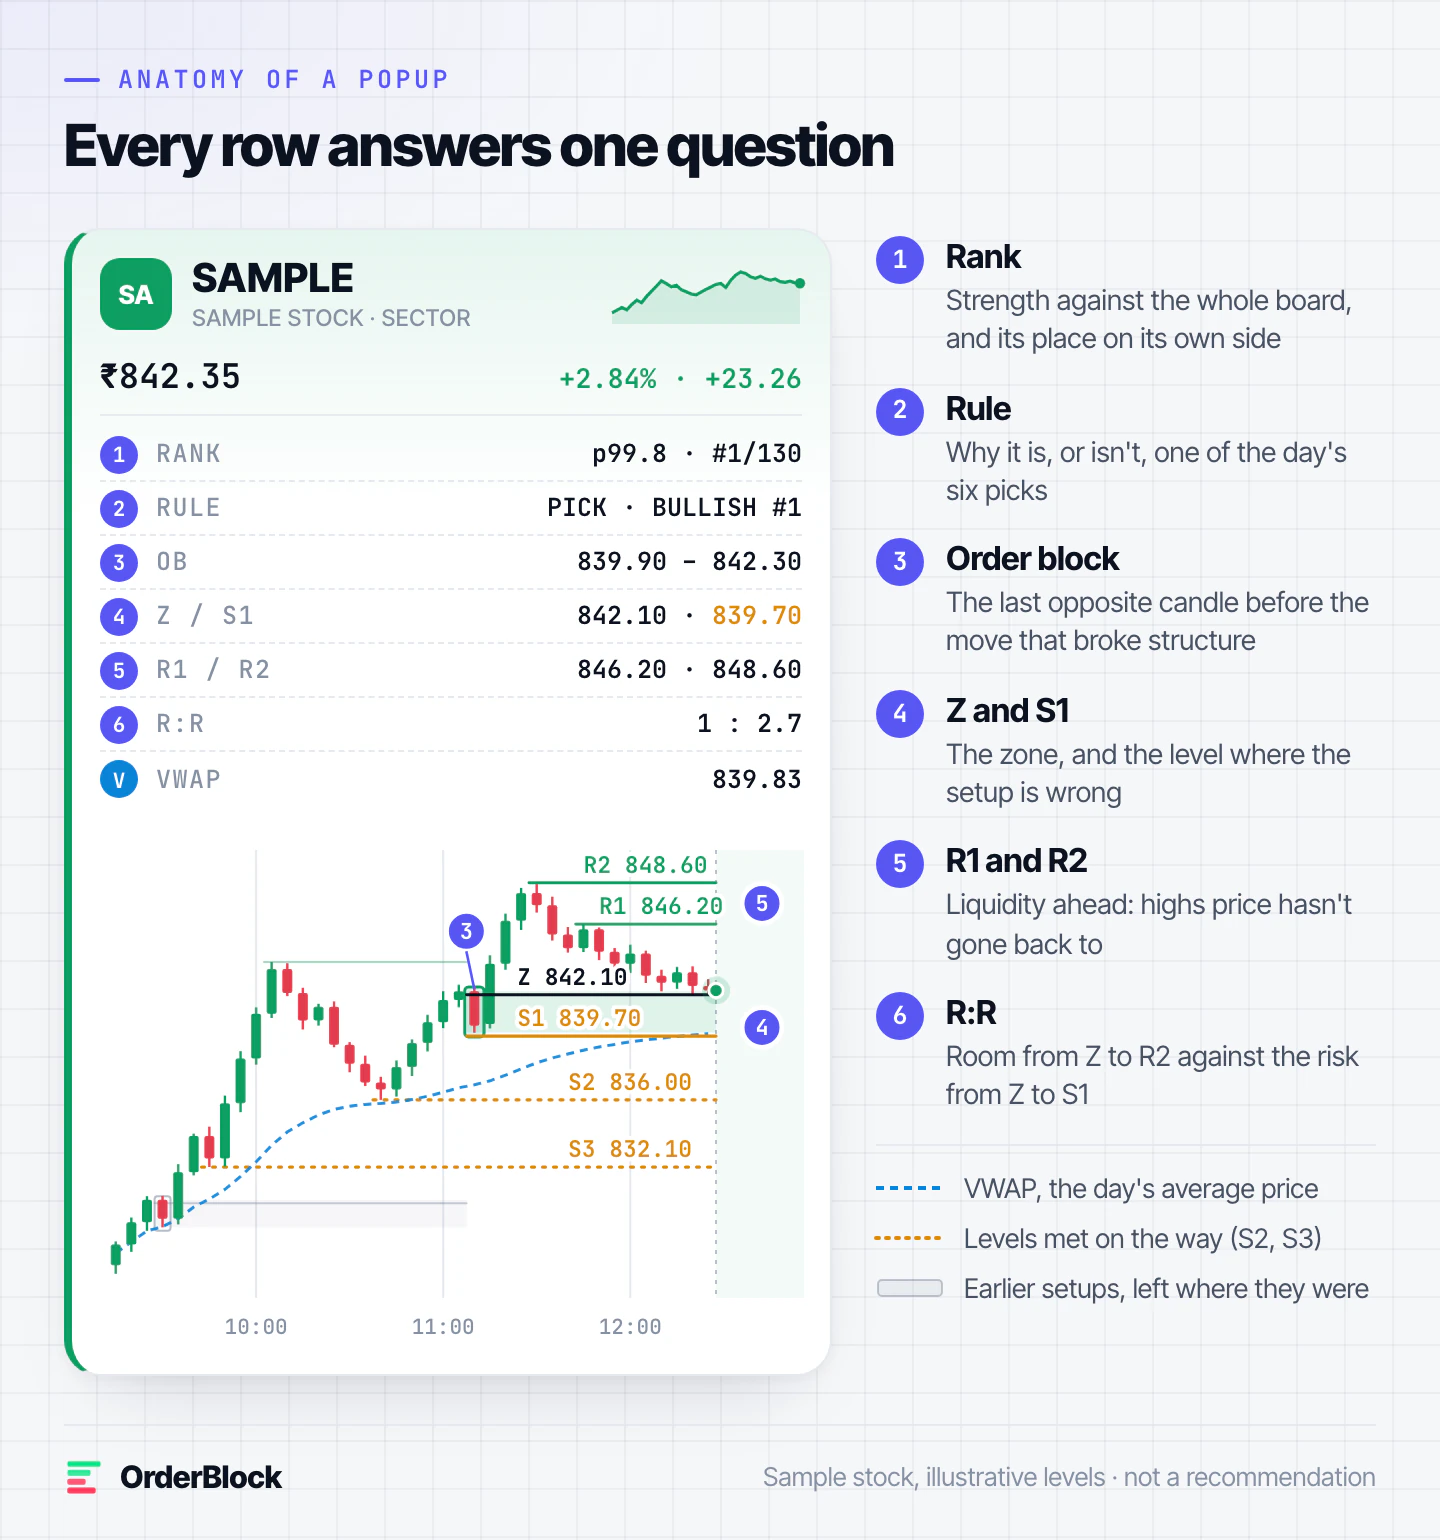
The header: what it is and how far it has come
Name, sector, last price and the day's move. The small line on the right is the day's path. A clean staircase means the stock has trended all day. A jagged line warns you the chart will be noisier.
1. RANK: where it stands
p99.8 · #1/130 reads as: stronger than 99.8% of the whole board, and number 1 of the 130 stocks on the bullish side. Bearish stocks read from the other end, so the strongest bearish stock sits near p0.
2. RULE: why it is, or isn't, a pick
PICK · BULLISH #1 means the stock made the top three on its side after two filters: no more than two picks from one sector, and no event-risk stocks. When a stock misses out, the row tells you why, for example NOT PICKED · sector cap or NOT PICKED · outside top 3. A stock with an unusually large fall is marked amber as event risk and gets no levels at all.
3. OB: the order block
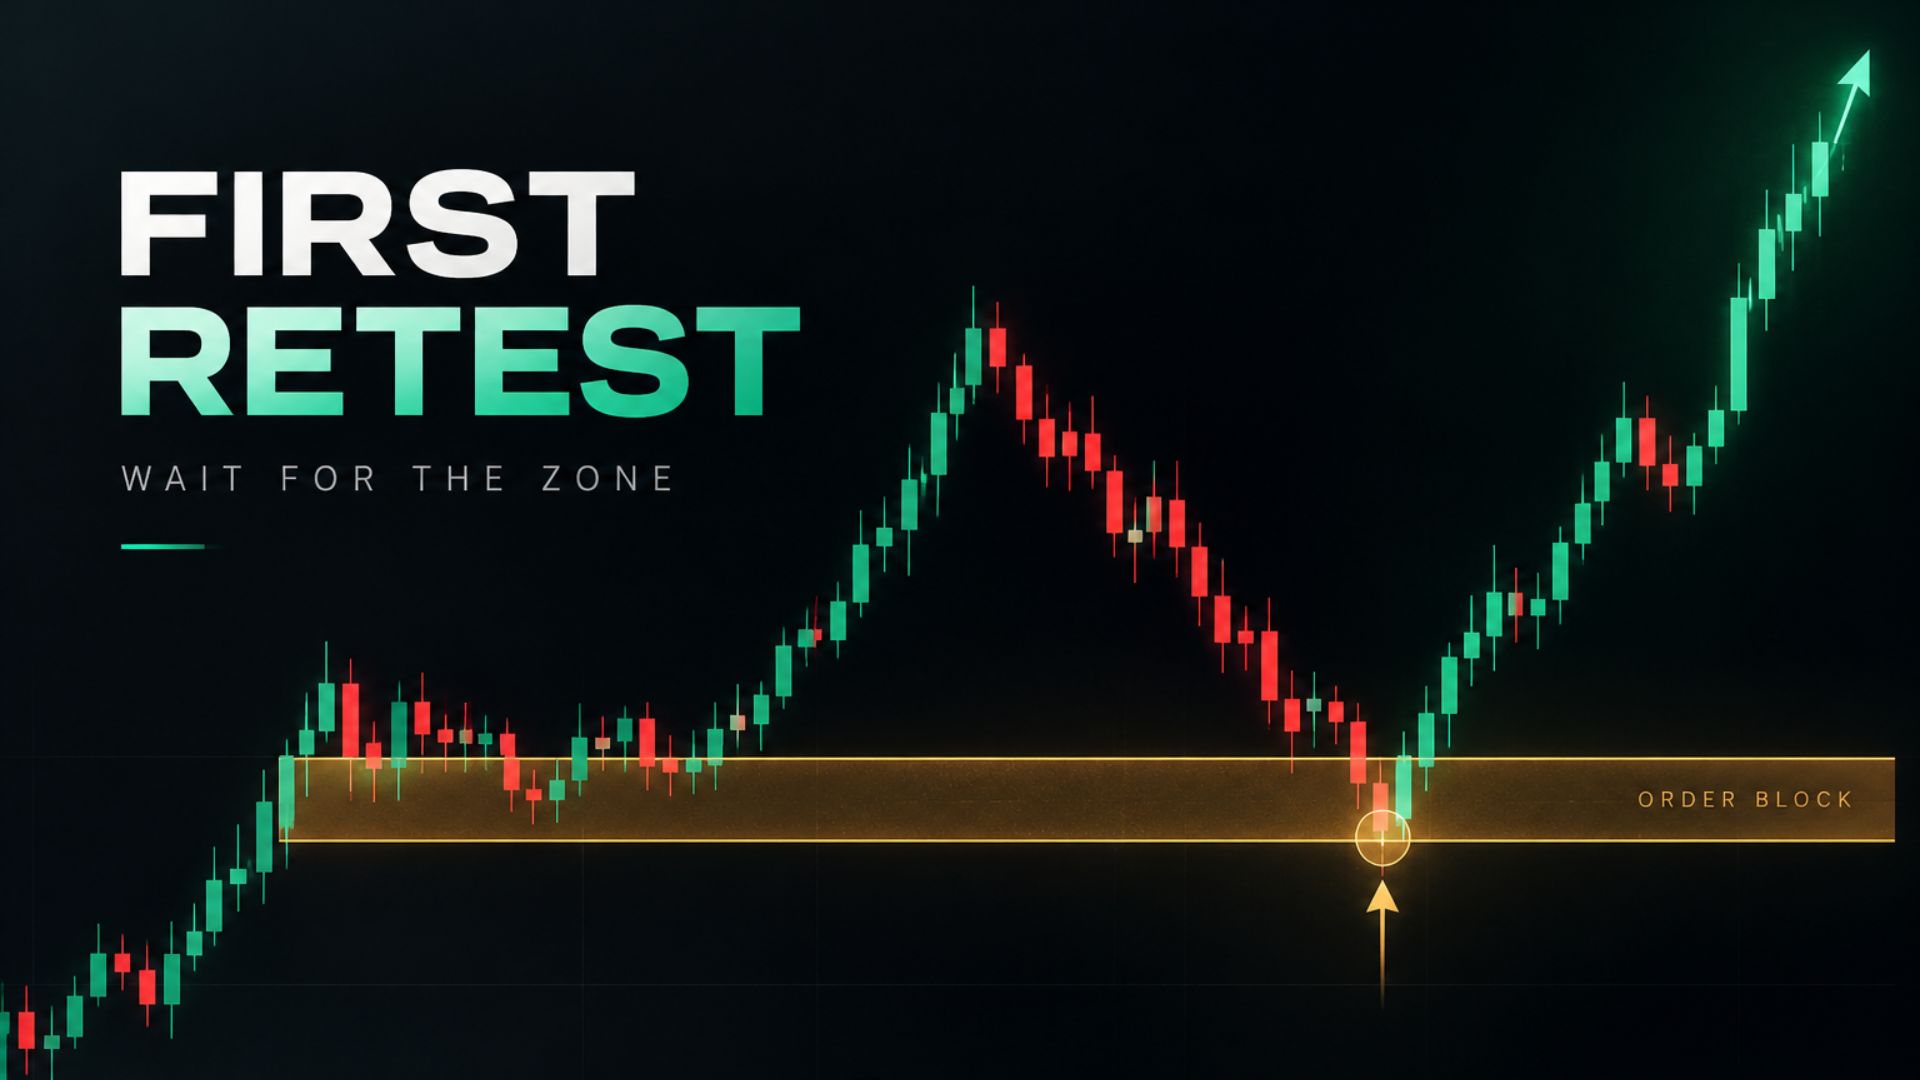
The price range of the order block: the last opposite candle before a forceful move that broke structure. On a bullish chart it is the last red candle before the rally that cleared an earlier swing high or the range of the first 15 minutes. The terminal reads finished 5-minute candles, so the block and its levels change at most once every five minutes.
4. Z and S1: the zone, and where you are wrong
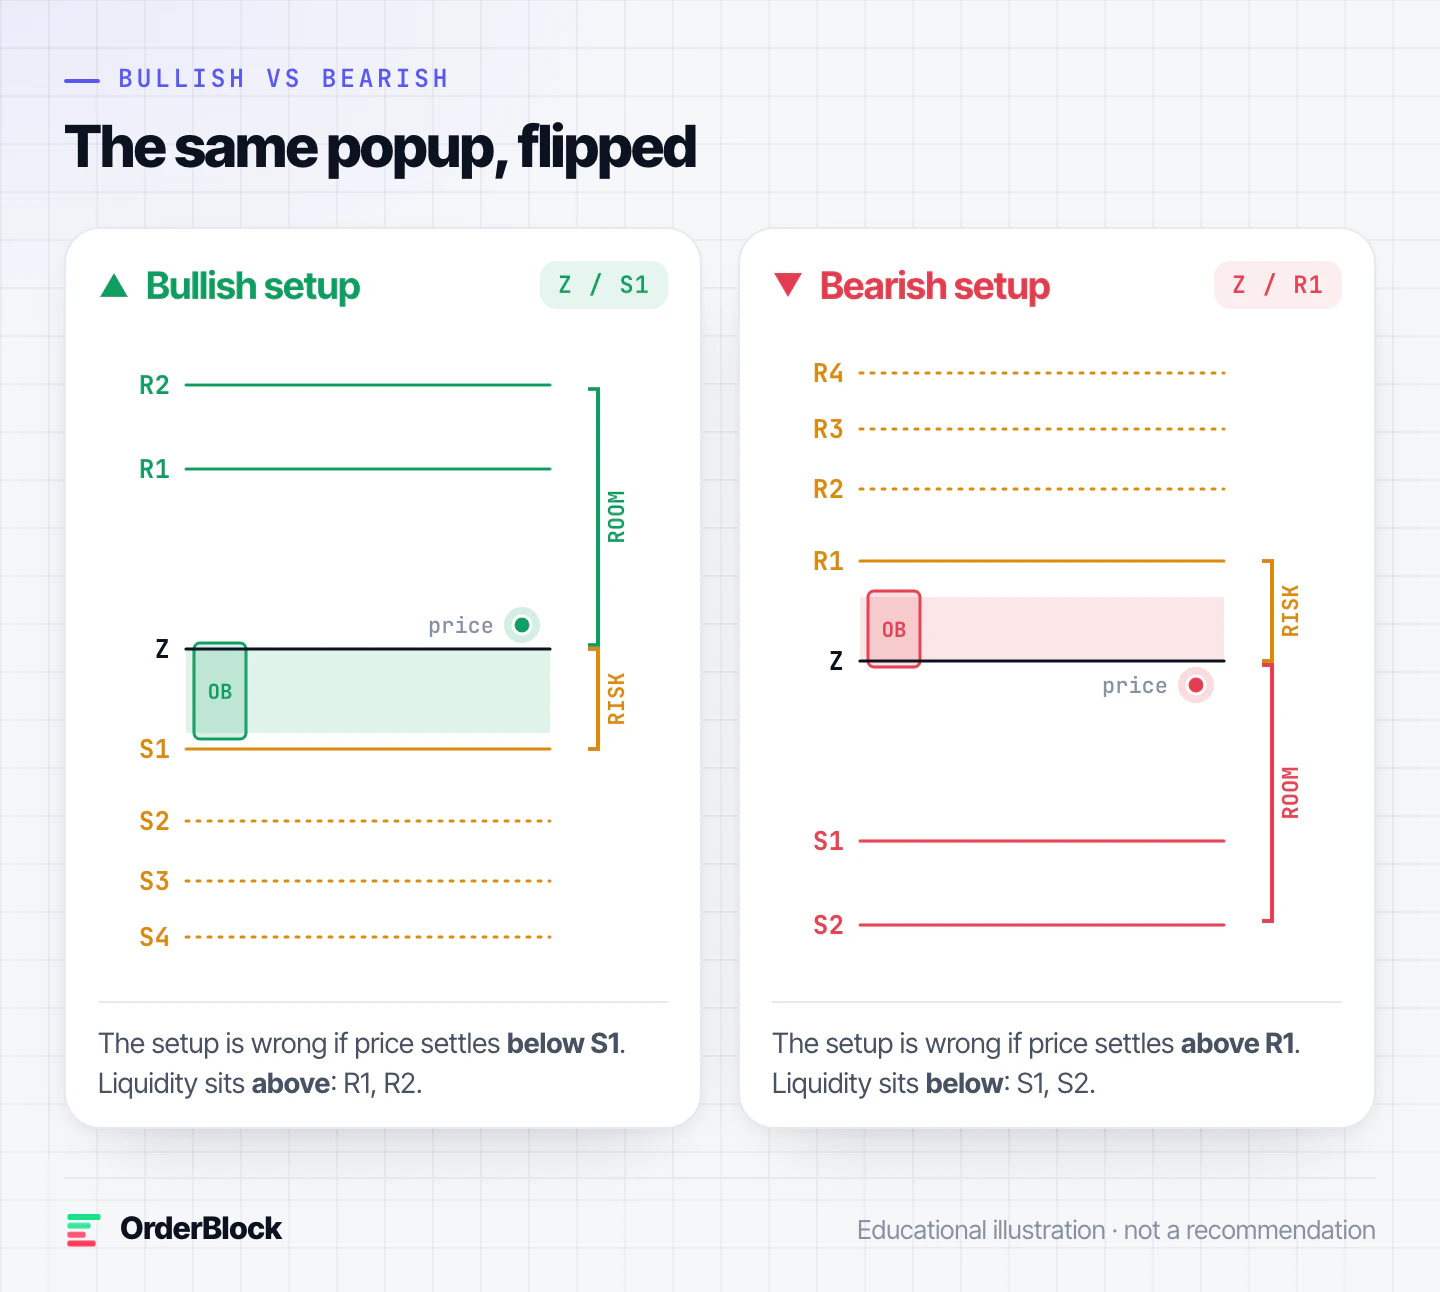
Z is the zone level, the price the whole setup is built around. S1 sits just beyond the far side of the block. If price settles below it, the demand that defended the block has gone and the setup no longer holds. On bearish popups the pair is Z and R1, just above the block.
The distance from Z to S1 is your risk per share. Read it before you read anything about reward.
5. R1 and R2: the liquidity ahead
On bullish popups, R1 and R2 are the next resistance levels in the direction of the move: swing highs price hasn't gone back to, the day's high, or an opposing block. Orders tend to rest around levels like these, which is why price is often drawn toward them. On bearish popups the same idea appears below price as S1 and S2.
6. R:R: is it worth it?
1 : 2.7 compares the room from Z to the second level with the risk from Z to the level where the setup is wrong. A setup at 1 : 0.8 can still move your way, but it pays less than it risks. Many traders set a floor, such as 1 : 1.5, and skip anything below it.
Reading the chart
- The box is the order block. The shaded band that runs from it is the zone.
- Labelled lines belong to the current setup, drawn from where it was marked.
- Unlabelled boxes and lines earlier in the day are previous setups, left where they happened, so you can see how the day's structure built up.
- Amber dotted lines (S2 to S4 on bullish charts, R2 to R4 on bearish ones) are levels price met on the way: swing points it never closed back through, the day's open and gaps that are still open. If price comes back further than planned, these are where it may react next.
- The dashed line is VWAP, the day's volume-weighted average price. Bullish setups above VWAP and bearish setups below it have the average participant on their side.
The 10-second read
- RANK and RULE: is this one of the day's strongest, and is it a pick?
- Price against Z: is price at the zone, or far away from it?
- Z to S1 (or R1): how much would I risk per share?
- R:R: does the room justify that risk?
- VWAP: is price on the right side of the day's average?
If any answer is no, close the popup and open the next one. The board has 20 stocks on each side.
Read next
- Let the zone come to you: patience, timing and the first retest
- Consistency is a number: position sizing, R:R and the journal loop
OrderBlock is a market data and analytics tool. This post is for education only. It is not investment advice or a recommendation to buy or sell any security, and its examples use sample numbers. Trading in F&O involves substantial risk.