Read the market before the stock: breadth, sectors and the market picture
A strong setup on the wrong kind of day is a coin toss. How to read the bullish and bearish counts, the sectors and the market picture in under a minute.

Picture two identical bullish order blocks on two different days. On the first, 170 F&O stocks are up and the stock's whole sector is green. On the second, 160 stocks are down and its sector is the day's weakest. The chart looks the same. The odds are not.
That's why the terminal puts the market picture at the very top, above every chart. It answers one question: which way is money leaning today?
What the market picture shows
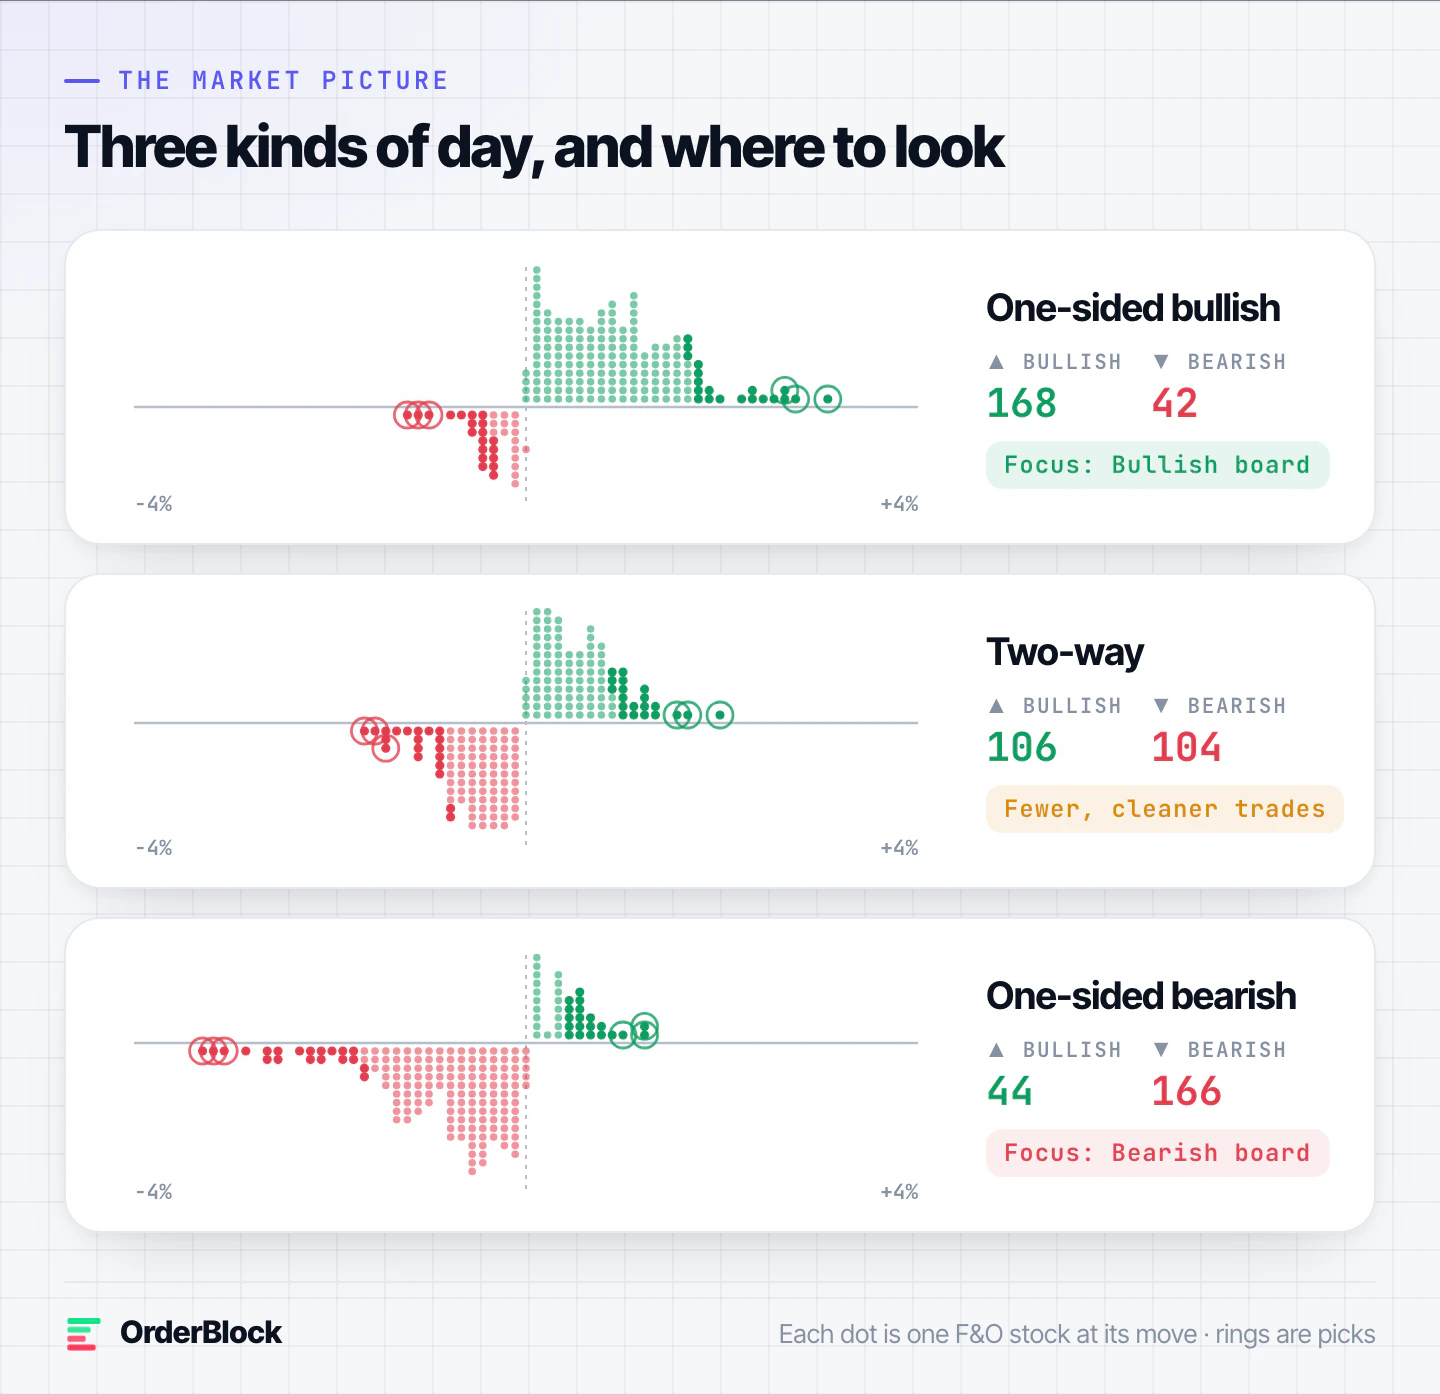
Every F&O stock is a dot, placed at its % move for the day on one scale. Bullish stocks stack above the line, bearish stocks below it, and big movers sit far from zero. The 40 contenders glow, the six picks are ringed and event-risk stocks are amber. Beside it are two numbers, how many stocks are bullish and how many are bearish, and two callouts that name the leading and the lagging sector with their average move.
Three shapes to recognise
One-sided bullish
The counts are lopsided (say 168 bullish against 42 bearish), the dots lean right and several picks sit far from zero. Bullish setups have the market behind them. Spend your attention on the Bullish board and treat bearish setups with extra suspicion.
Two-way
The counts are close, the dots crowd around zero and neither sector callout shows much of a move. Moves fade more easily and zones break more often. Fewer trades, smaller size, and only the cleanest setups.
One-sided bearish
The mirror of the first: most dots below the line and the counts leaning bearish. The Bearish board deserves your attention.
The counts don't tell you what one stock will do. They tell you which side of the board deserves your time.
Sectors: the wind behind the stock
Large participants rarely trade one stock alone. When they add to banks or cut back on IT, they move baskets, so most stocks in a sector lean the same way. The sector list shows each sector's average move and a small cell for every stock in it: green if it is up, red if it is down.
- Strong stock, strong sector: the best combination. A pullback into the zone has the rest of the basket behind it.
- Strong stock, weak sector: often one piece of news or one large order. Once that flow is done, nothing is left to carry the move. Be careful.
- Participation matters: a sector up 0.5% with 11 of 12 cells green is a sector move. The same 0.5% with 3 of 12 green is a few stocks dragging the average.
The picks already respect sectors in one way: no more than two can come from the same sector, so a single sector's news can't fill the whole shortlist.
The four-point alignment check
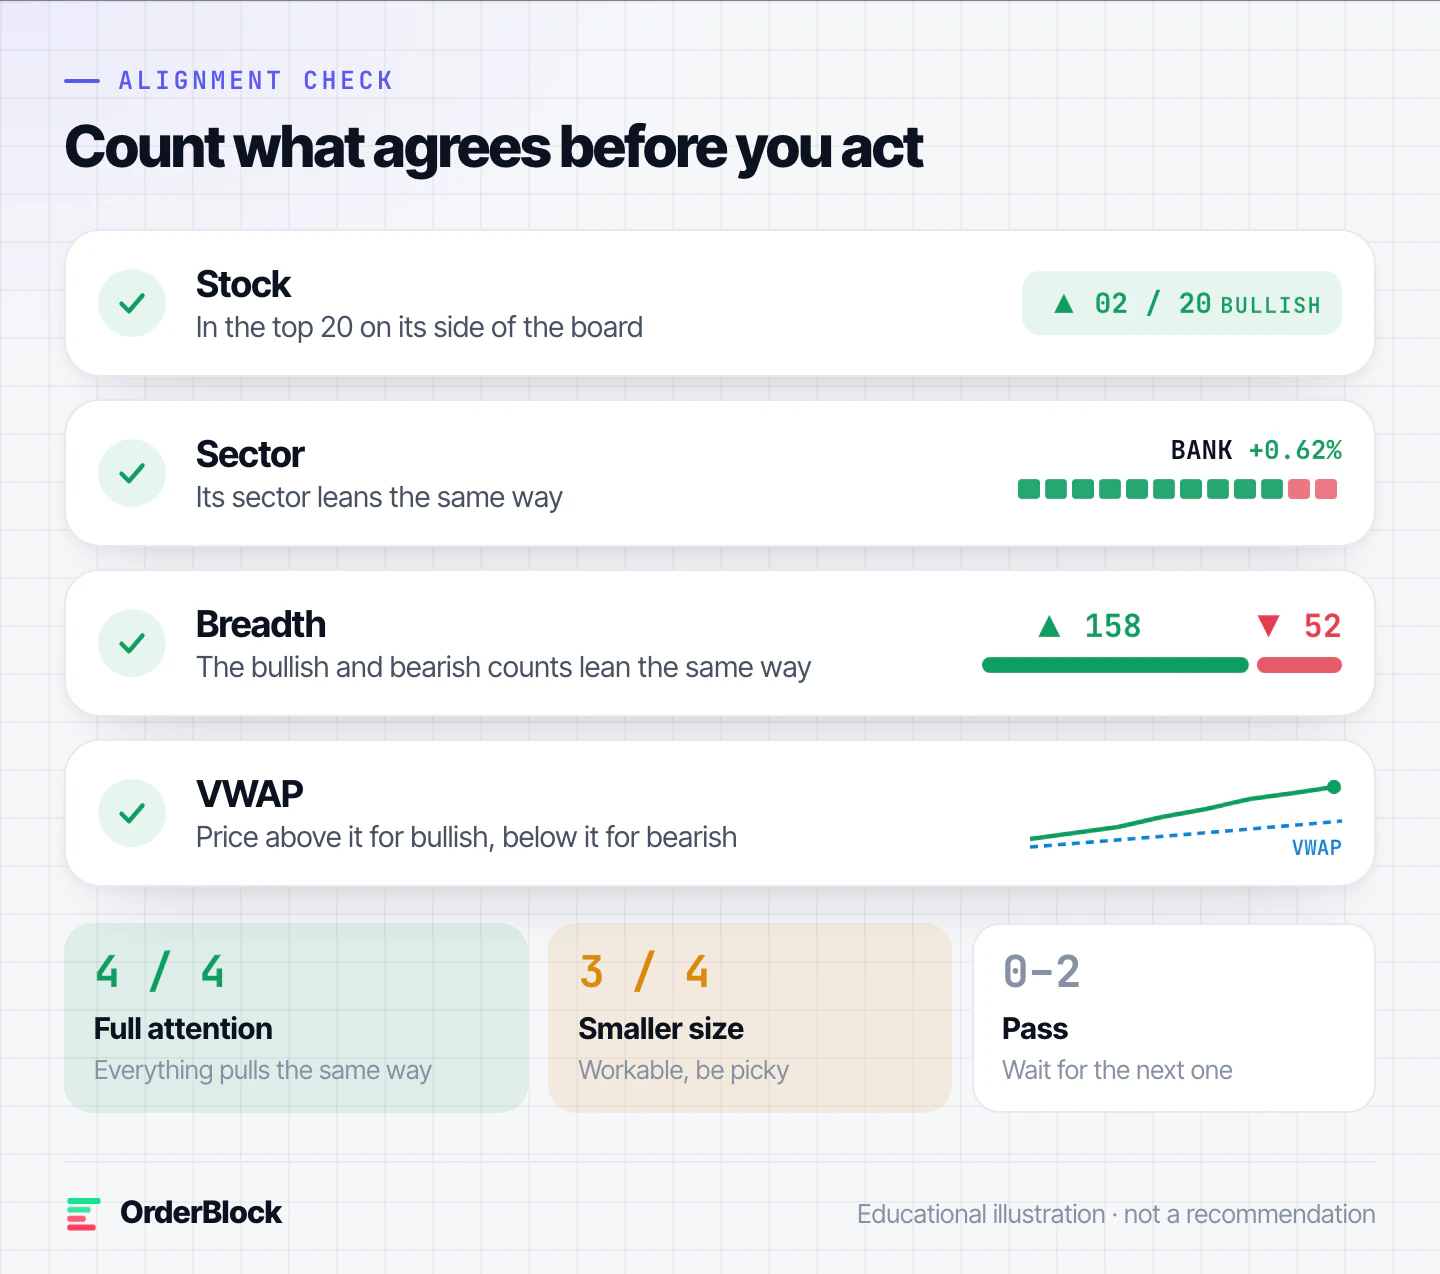
Before acting on any setup, count how many of these agree with it:
- Stock: it is in the top 20 on its side of the board.
- Sector: its sector leans the same way.
- Breadth: the bullish and bearish counts lean the same way.
- VWAP: price is above VWAP for a bullish setup, below it for a bearish one.
Four out of four deserves your full attention. Three is workable at a smaller size. Two or fewer is usually a pass. You will miss some moves that way, and that's fine: consistency comes as much from the trades you skip as from the ones you take.
Look again at midday
Leadership rotates. A sector that led the morning can fade by lunch while another takes over. Check the market picture again around 11:30 and 13:30 rather than trading the afternoon on the morning's read. The board and the picture refresh every minute, so the answer is always current.
Read next
- The OrderBlock daily playbook: from 200+ stocks to one clear zone
- Let the zone come to you: patience, timing and the first retest
OrderBlock is a market data and analytics tool. This post is for education only. It is not investment advice or a recommendation to buy or sell any security, and its examples use sample numbers. Trading in F&O involves substantial risk.