Consistency is a number: position sizing, R:R and the journal loop
Consistent results start with consistent losses. How to size every setup from its zone, what R:R does to the win rate you need, and a weekly journal loop that shows what works.
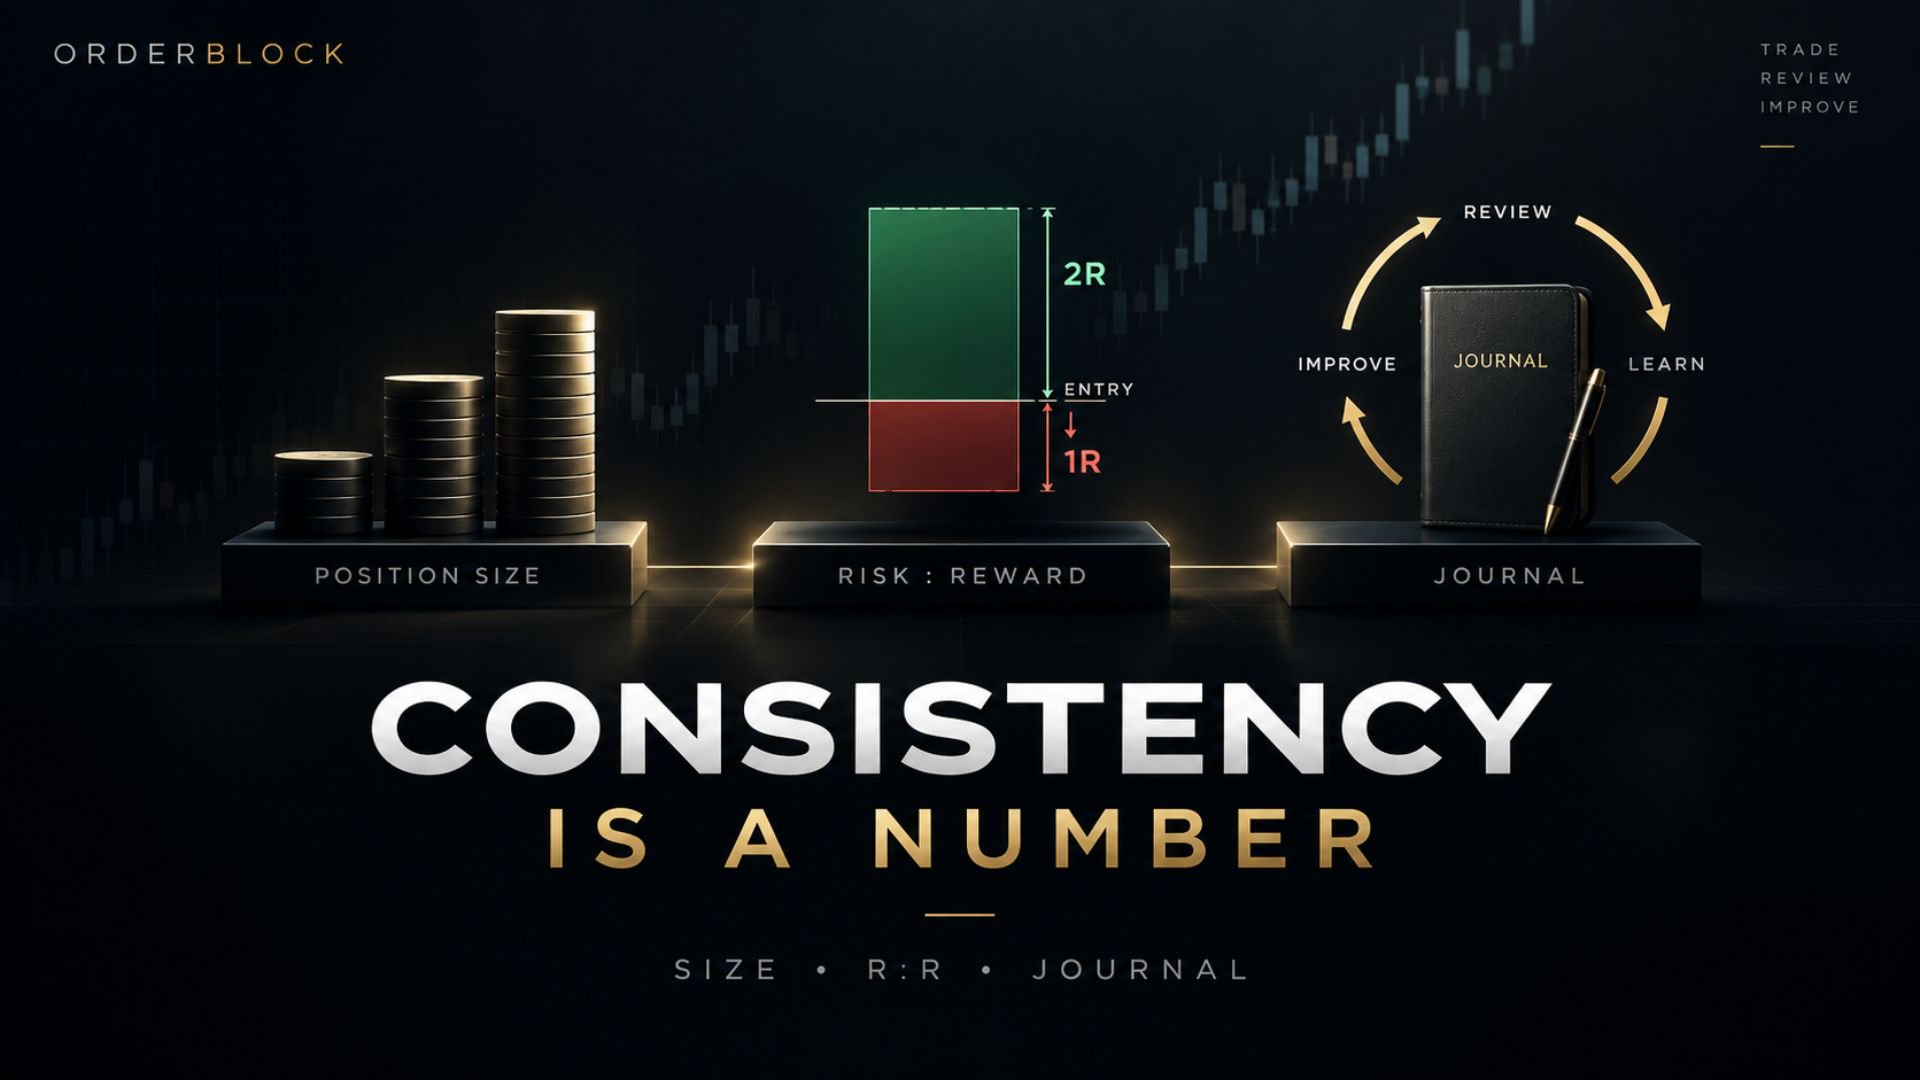
Ask a room of traders what consistency means and most will describe an outcome: green weeks, a rising curve. The part you actually control is smaller and more boring: every loss about the same size, every trade chosen the same way, every result written down.
The popup gives you the numbers to do this on every setup. Here is how to use them.
Size from the zone, not from a feeling
Your risk on a trade is the distance from Z to the level where the setup is wrong (S1 on bullish popups, R1 on bearish ones), multiplied by your quantity. Choose a fixed slice of your capital as the most any single trade may cost. 1% is a common ceiling.
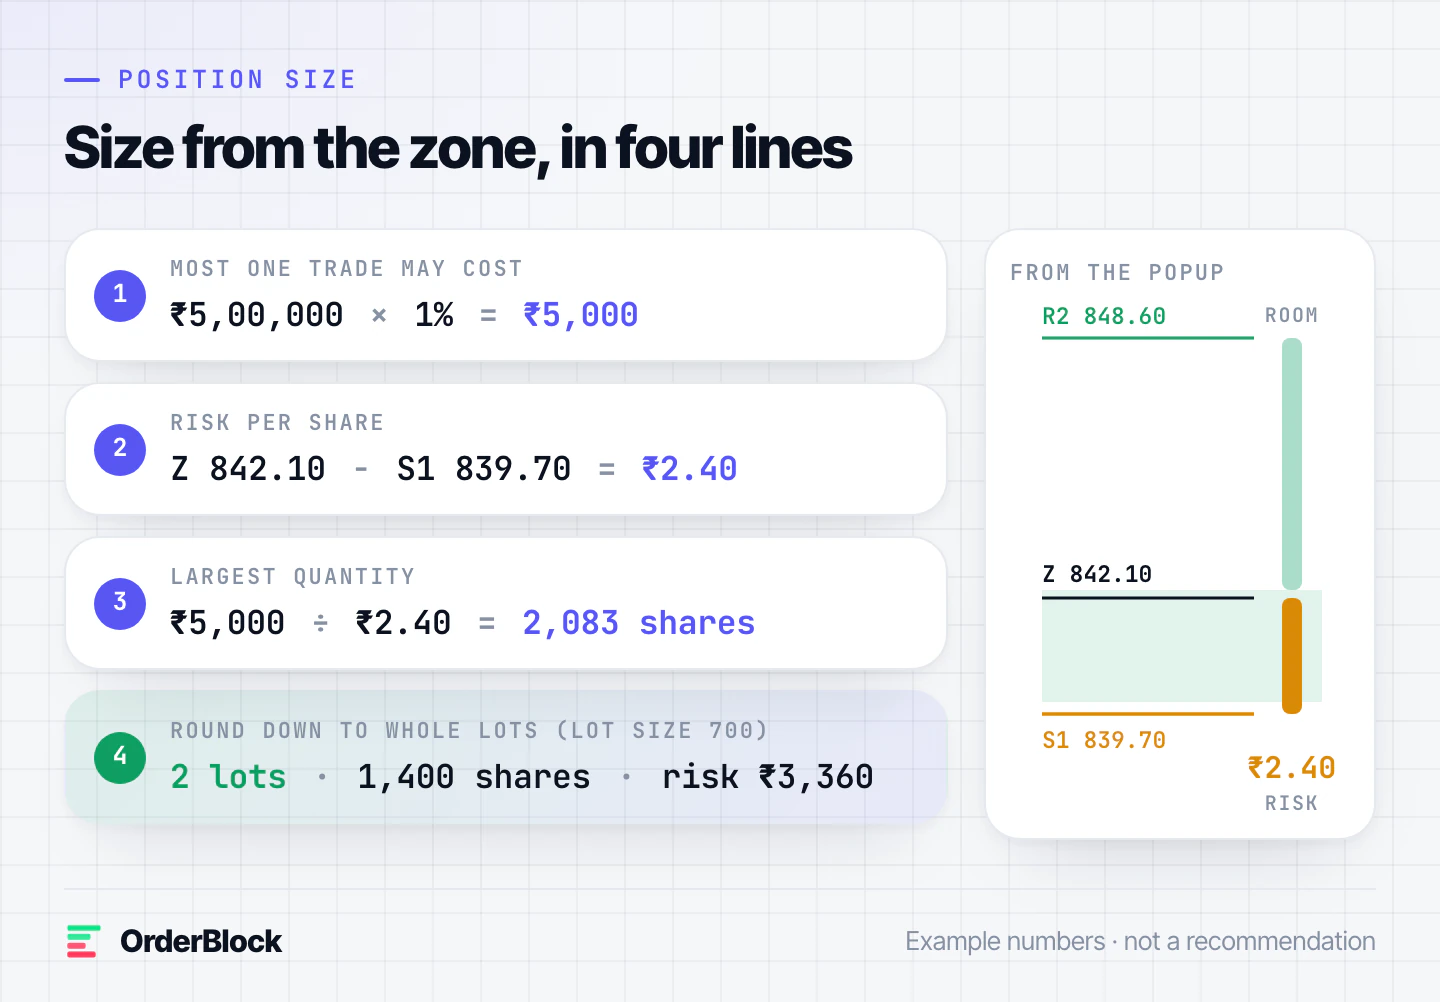
- Capital: ₹5,00,000. At 1%, the most one trade may cost is ₹5,000.
- Risk per share: Z ₹842.10 minus S1 ₹839.70 is ₹2.40.
- Largest quantity: ₹5,000 ÷ ₹2.40 = 2,083 shares.
- Whole lots: with a lot size of 700, that rounds down to 2 lots (1,400 shares), risking ₹3,360.
If the quantity rounds down to zero lots, the setup is too wide for your account: trade a smaller quantity in the cash market, or skip it. Never drag S1 closer just to make the size fit. S1 marks where the setup is wrong, not where the loss starts to feel uncomfortable.
What R:R does to the win rate you need
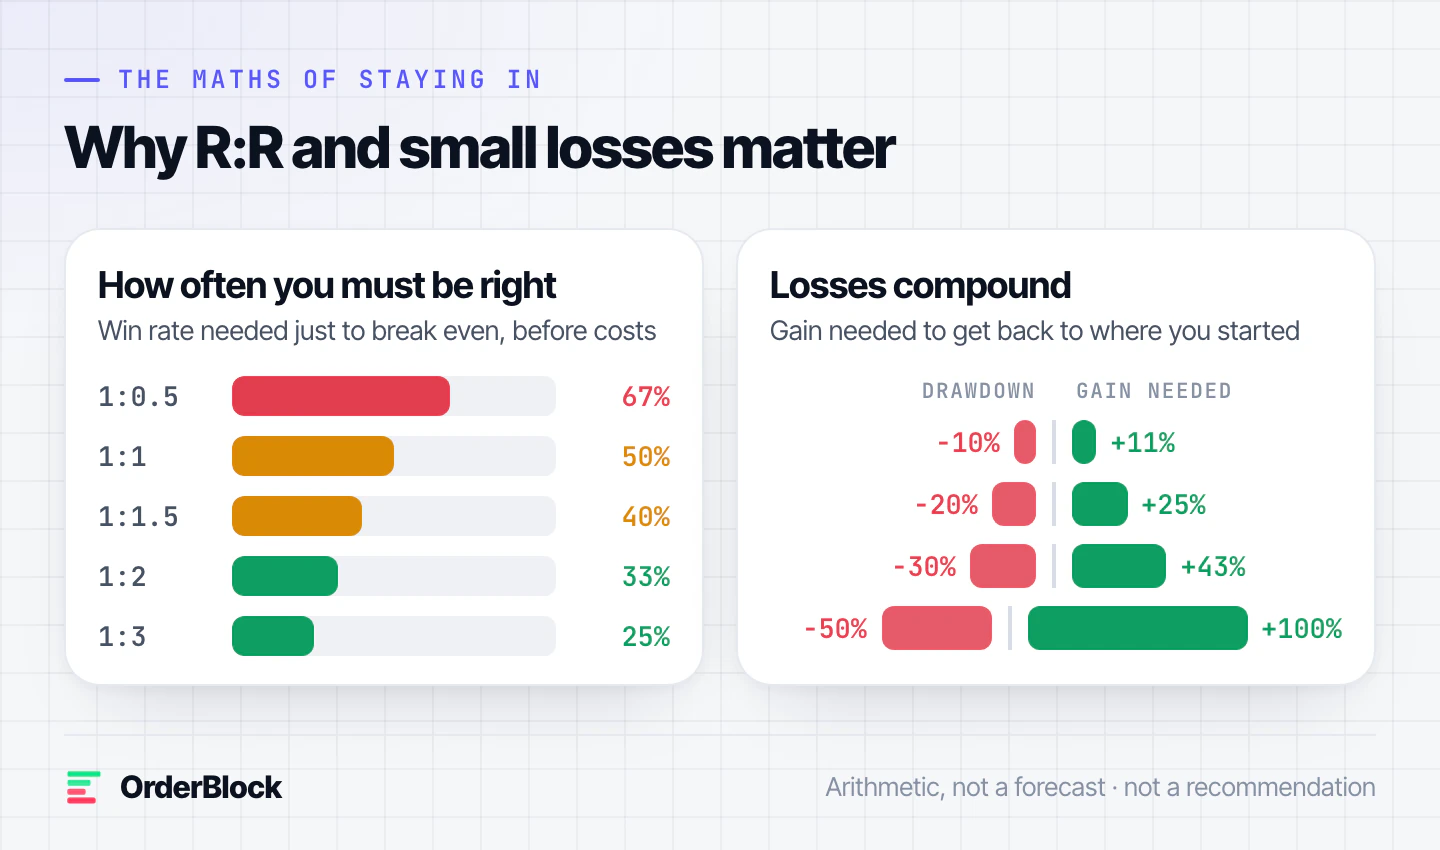
The R:R row decides how often you must be right just to break even, before costs. The arithmetic is simple: risk ÷ (risk + room).
| R:R | Right this often to break even |
|---|---|
| 1 : 0.5 | 67% |
| 1 : 1 | 50% |
| 1 : 1.5 | 40% |
| 1 : 2 | 33% |
| 1 : 3 | 25% |
Nobody knows their win rate in advance, so R:R is the one lever you can pull before acting. A floor like 1 : 1.5 quietly removes the setups that need you to be right most of the time.
Losses compound faster than gains
A 10% drawdown needs an 11% gain to recover. A 30% drawdown needs 43%. A 50% drawdown needs 100%. This asymmetry is why a small, fixed risk matters more than any single setup.
Two limits keep a bad day from turning into a bad month:
- A daily loss limit: stop for the day at, say, 2% of capital or after two losses in a row, whichever comes first.
- No size-ups after a loss: the next trade is sized exactly like the last one. "Winning it back" is how 1% becomes 5%.
The journal loop
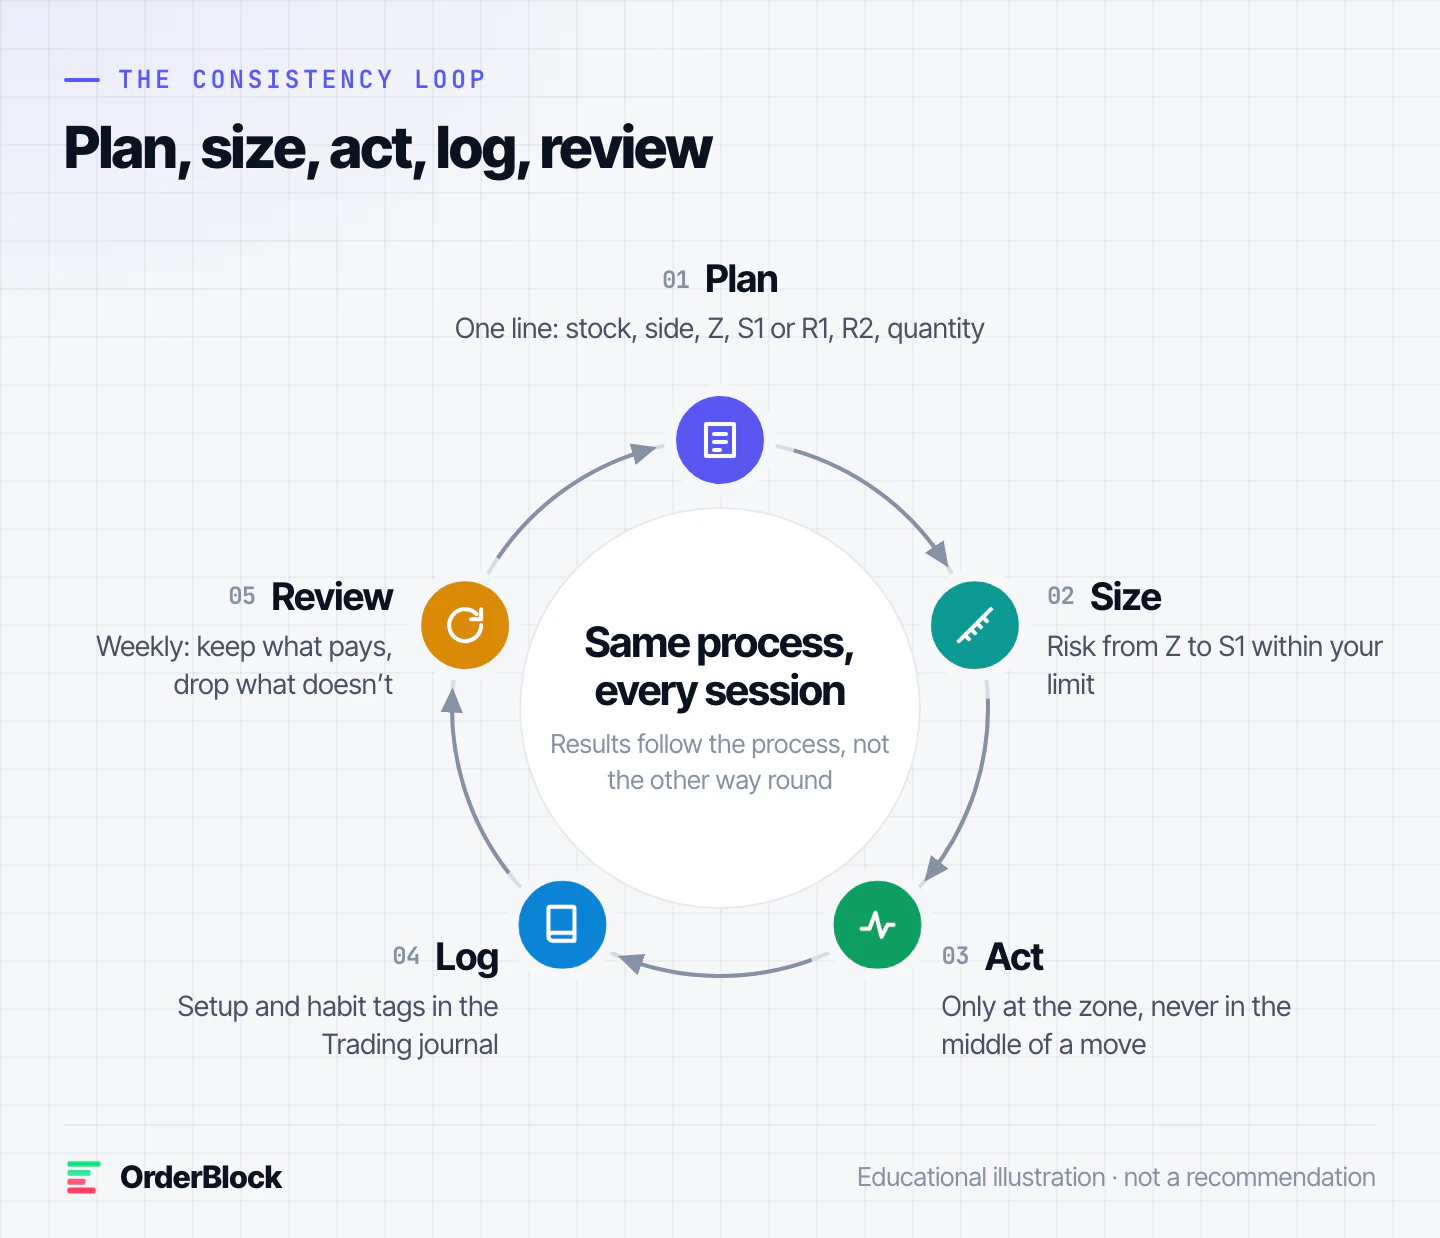
The Trading journal in your member area turns the process into data. Log each trade in a few taps, give it a setup and a habit tag, and see your results on the P&L calendar and in P&L by setup. The loop:
- Plan: one line before acting, with the stock, the side, Z, S1 or R1, R2 and the quantity.
- Size: keep the risk inside your fixed slice.
- Act: only at the zone.
- Log: the result, the setup ("Pick #1, first retest") and any habit tag ("Chased", "Two-way day").
- Review weekly: sort by setup and by tag. Keep doing what works, and stop doing what doesn't.
After a month the tags usually tell a clear story. It is common to find that one habit, often chasing, explains a large share of the losses.
You can't control the next trade's result. You can control its size, its reason and whether you wrote it down.
Read next
- The OrderBlock daily playbook: from 200+ stocks to one clear zone
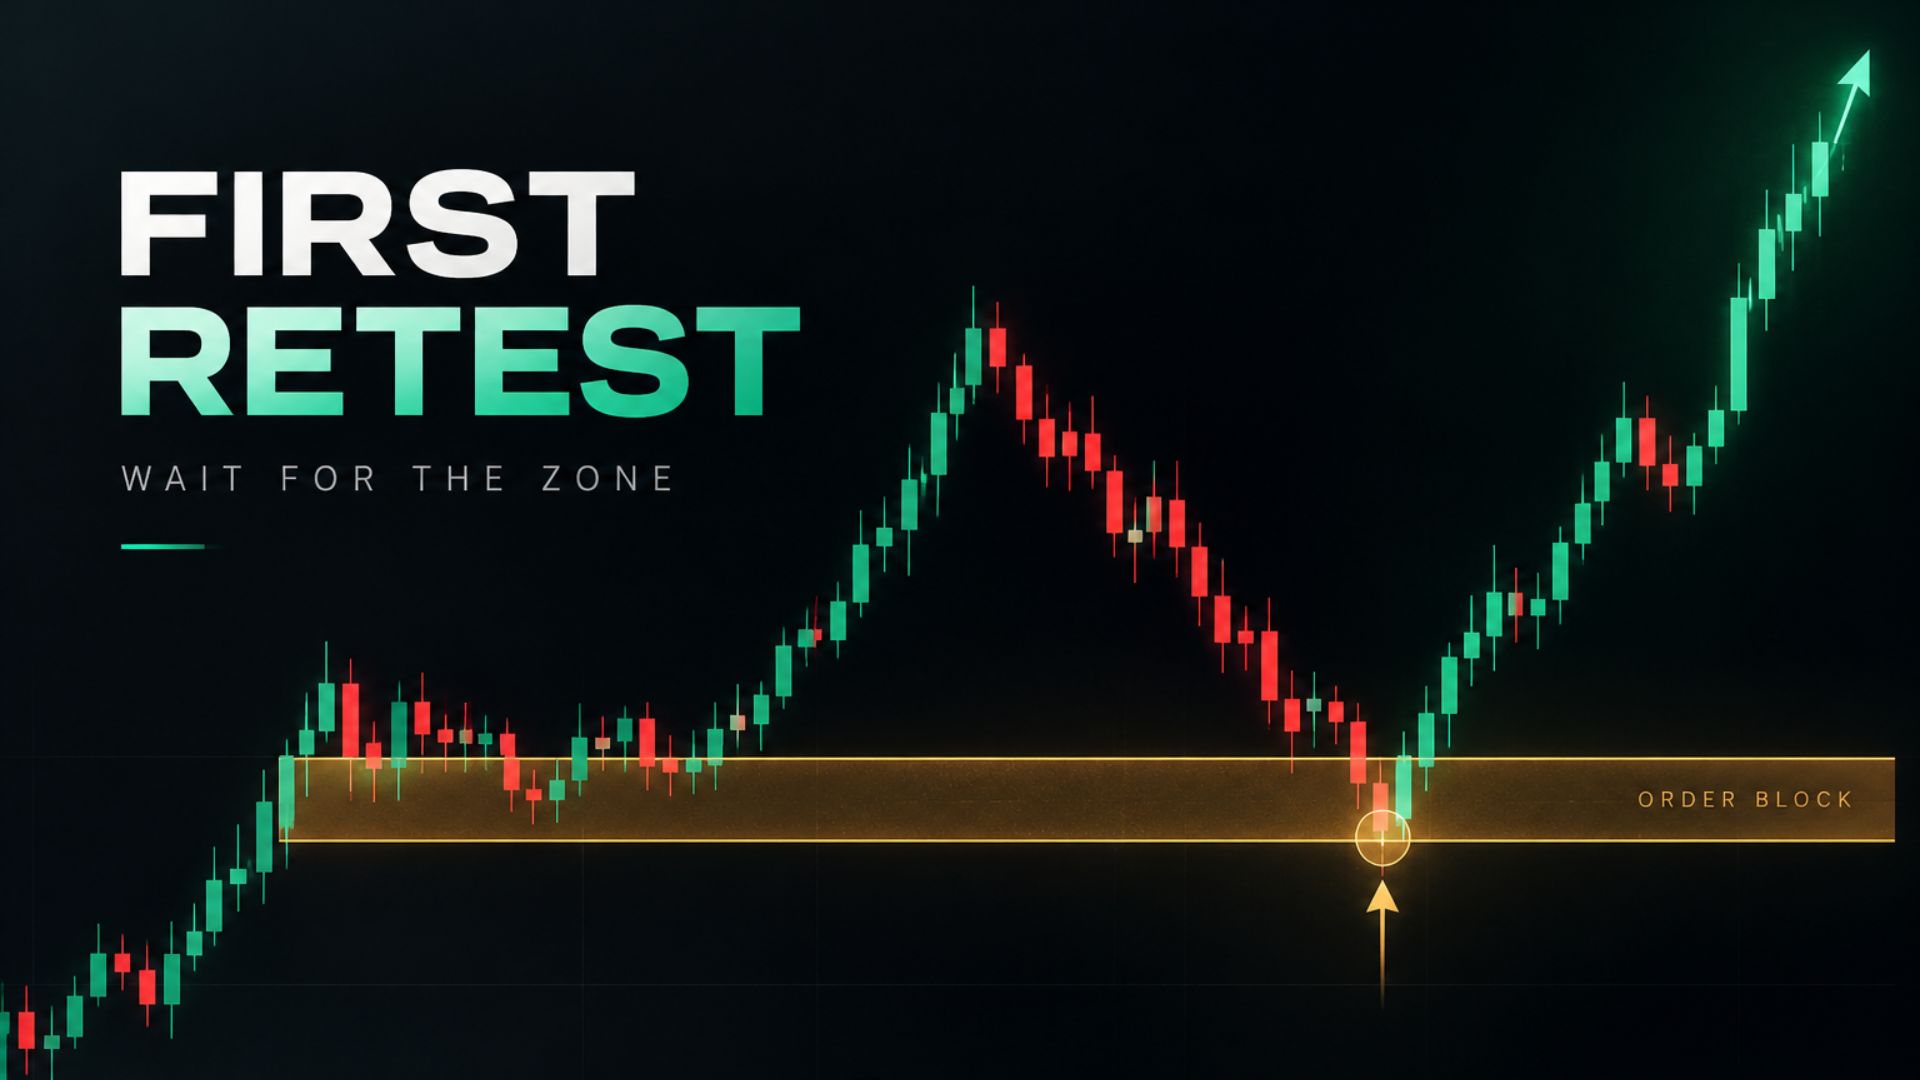
- Let the zone come to you: patience, timing and the first retest
OrderBlock is a market data and analytics tool. This post is for education only. It is not investment advice or a recommendation to buy or sell any security, and its examples use sample numbers. Trading in F&O involves substantial risk.