What is an order block?
An order block is where big players likely left orders before a sharp move. Learn bullish and bearish order blocks on Indian F&O stocks, in pictures.
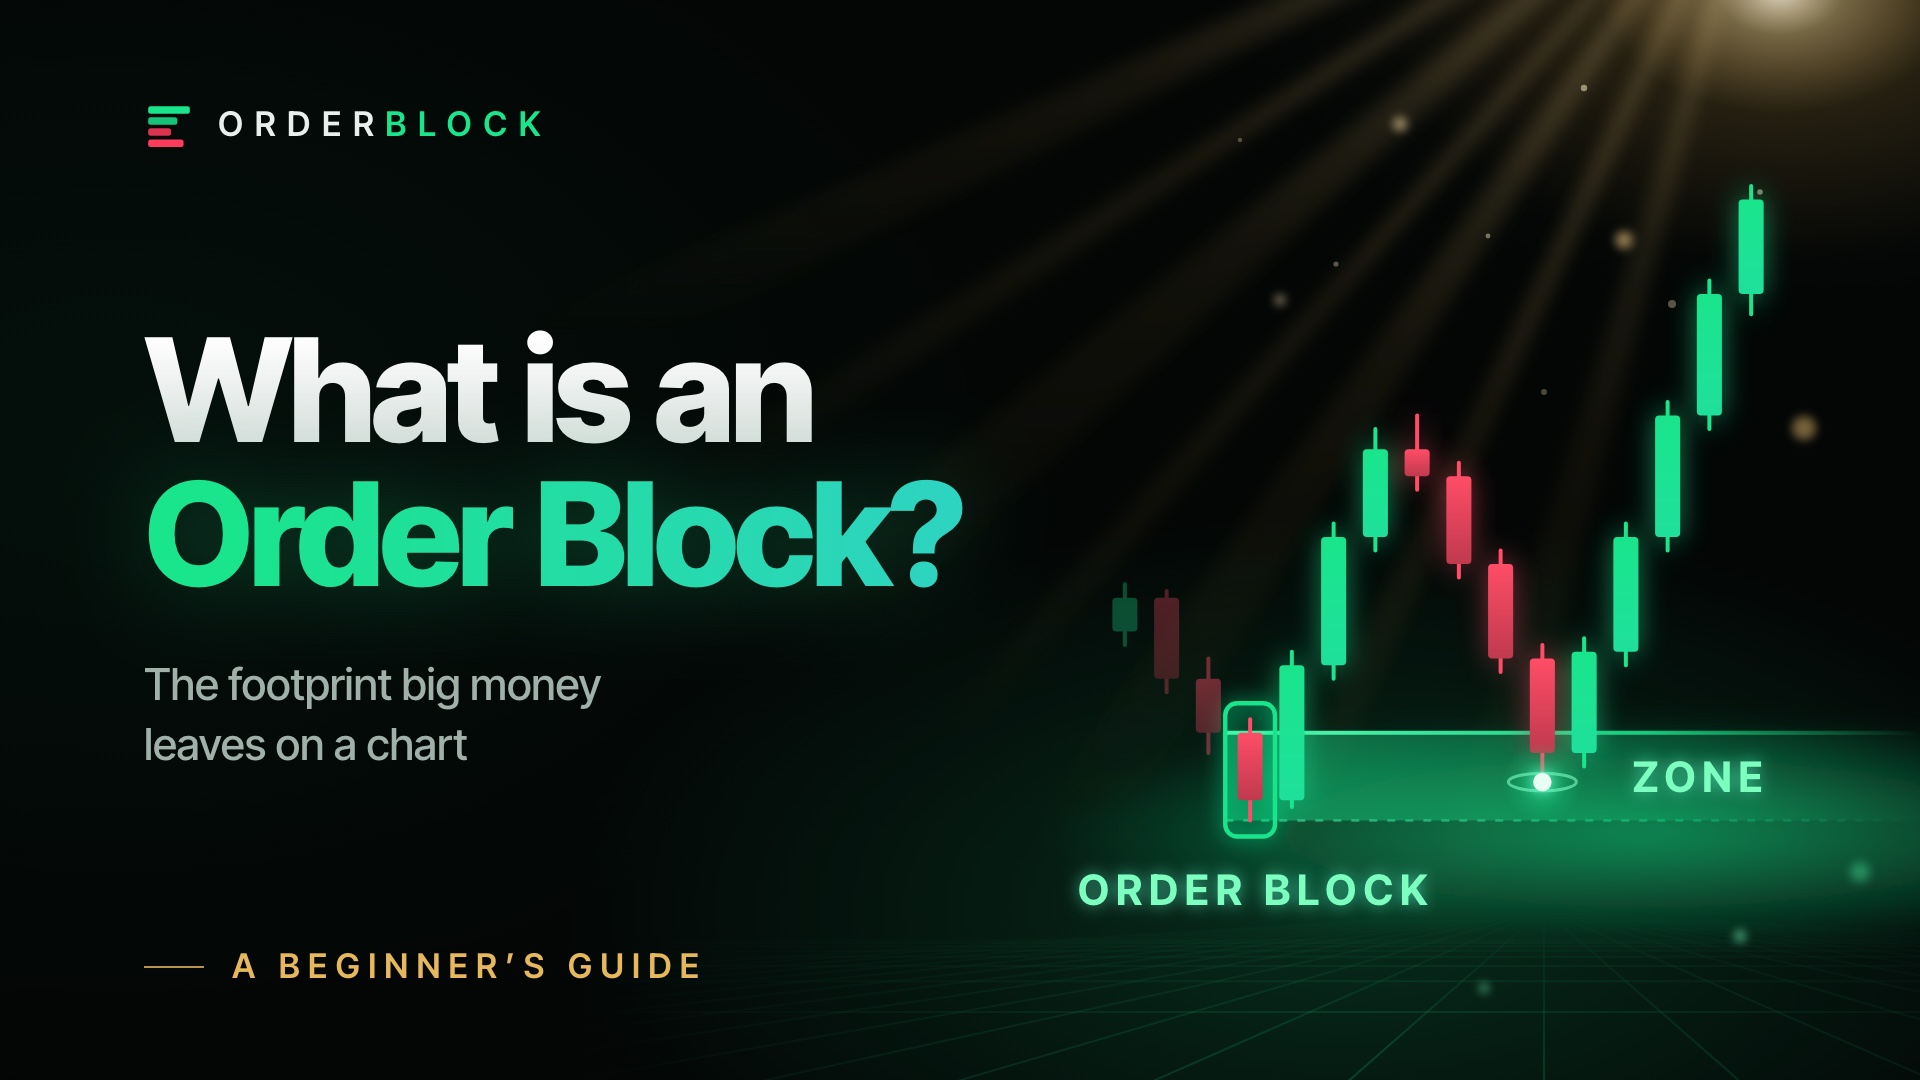
Most of a chart is noise. But a few places on it are different. These are the places where big players, funds that trade lakhs of shares at a time, likely left their orders. Traders call them order blocks. Once you can see them, a chart stops looking random.
This guide explains them in plain words and pictures. No maths, and every new word is explained.
What is an order block in trading?
An order block is the last red candle before a strong rise, or the last green candle before a strong fall, when that move closes beyond a recent high or low. It marks the zone where big players likely placed large orders. Price often comes back to that zone before it moves on.
In a bullish order block, the candle is red and the strong move after it is up. In a bearish order block, the candle is green and the strong move after it is down. The name comes from the move, not from the candle's colour.
An order block in one picture
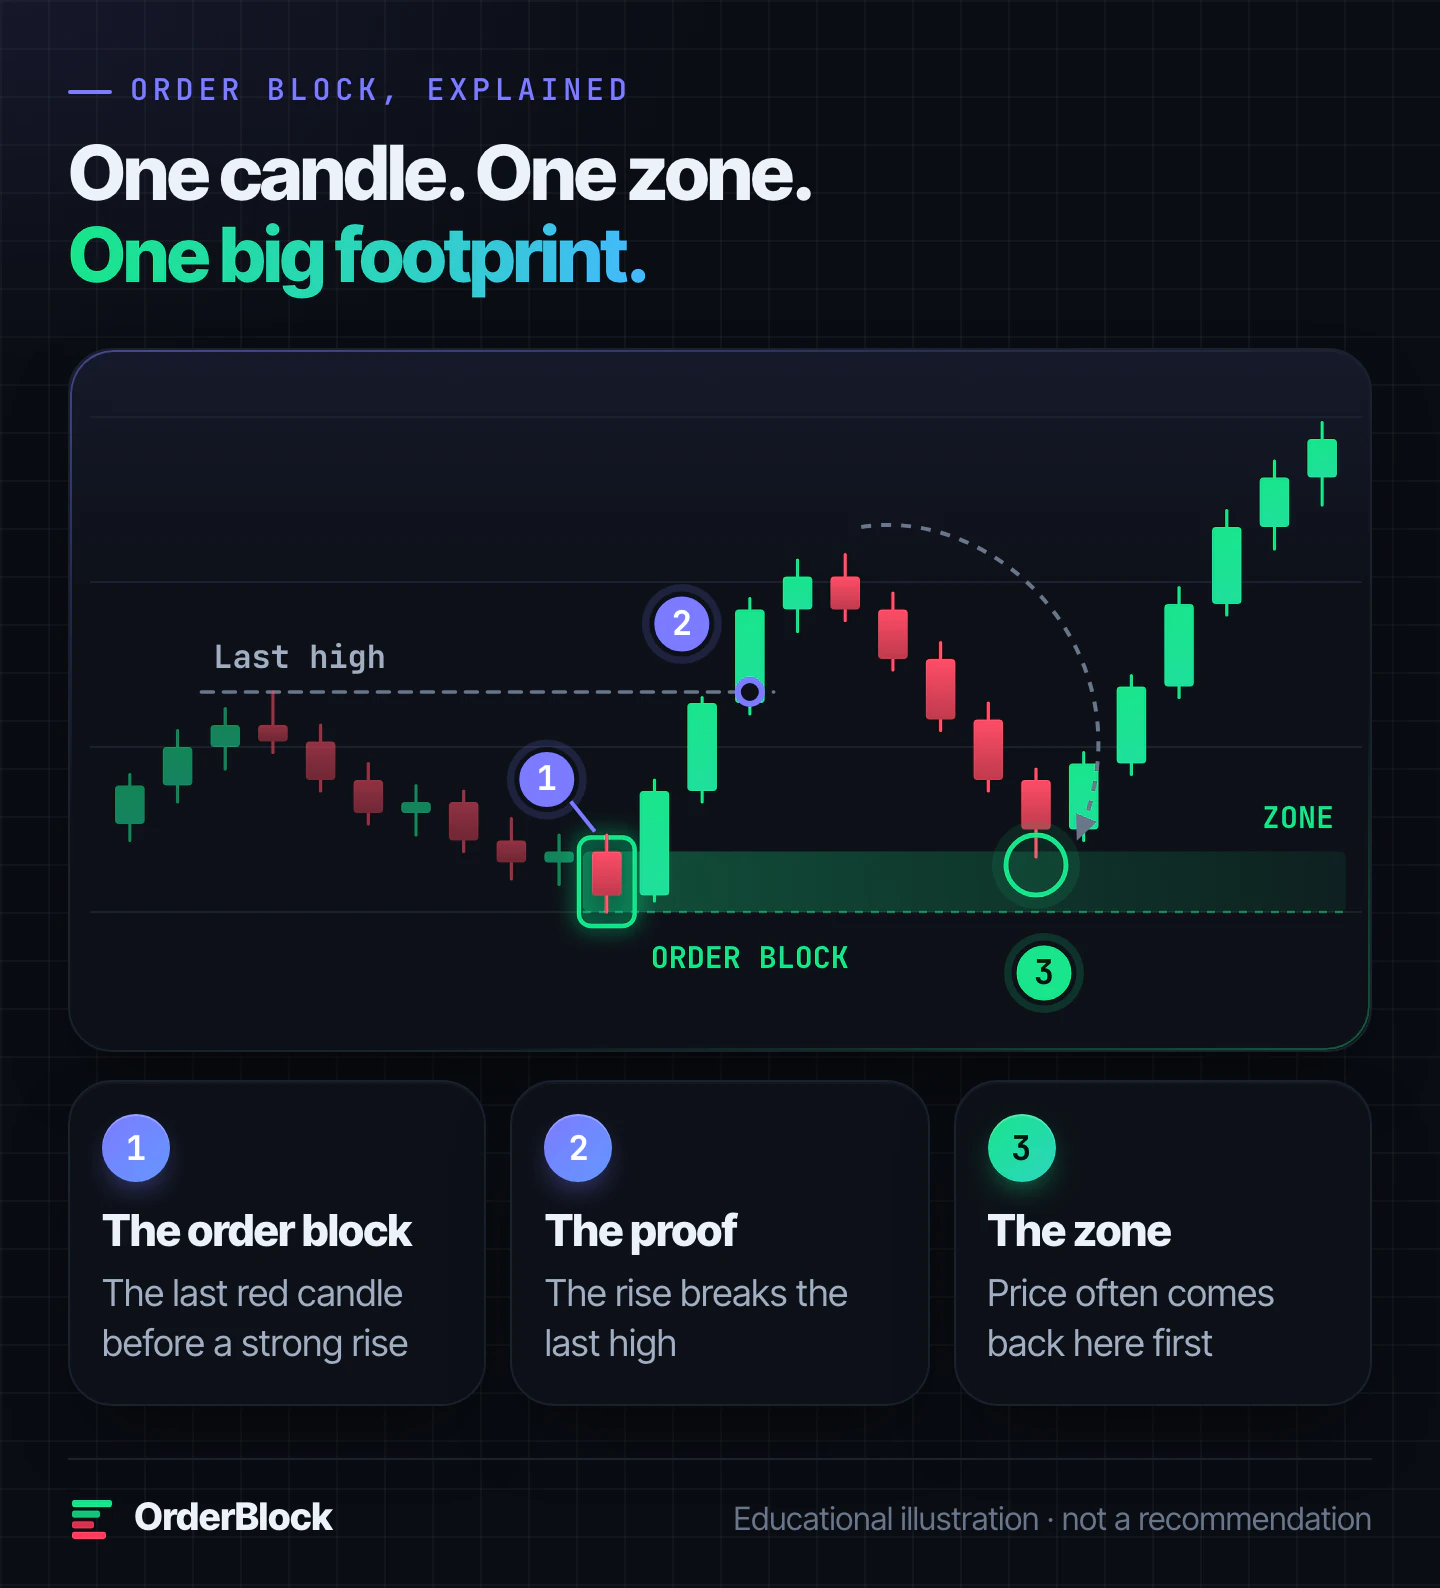
Read it from left to right:
- The order block. Price falls for a while. The last red candle before the turn is the order block.
- The proof. Price then rises so hard that a candle closes above the last high. Without that break, it is just another red candle.
- The zone. The order block becomes a zone, drawn forward to the right of the chart. When price comes back down to it, it often turns up again.
Why do order blocks form?
Imagine a fund that wants 10 lakh shares of a stock near ₹500. At that price, perhaps only 2 lakh shares are on offer. The fund takes what it can, and price jumps, because there is nothing left at ₹500.
The fund still needs 8 lakh more. It doesn't want to pay a higher price, so it leaves those orders waiting near ₹500. When price drifts back down, the waiting orders absorb the drop and price turns up again.
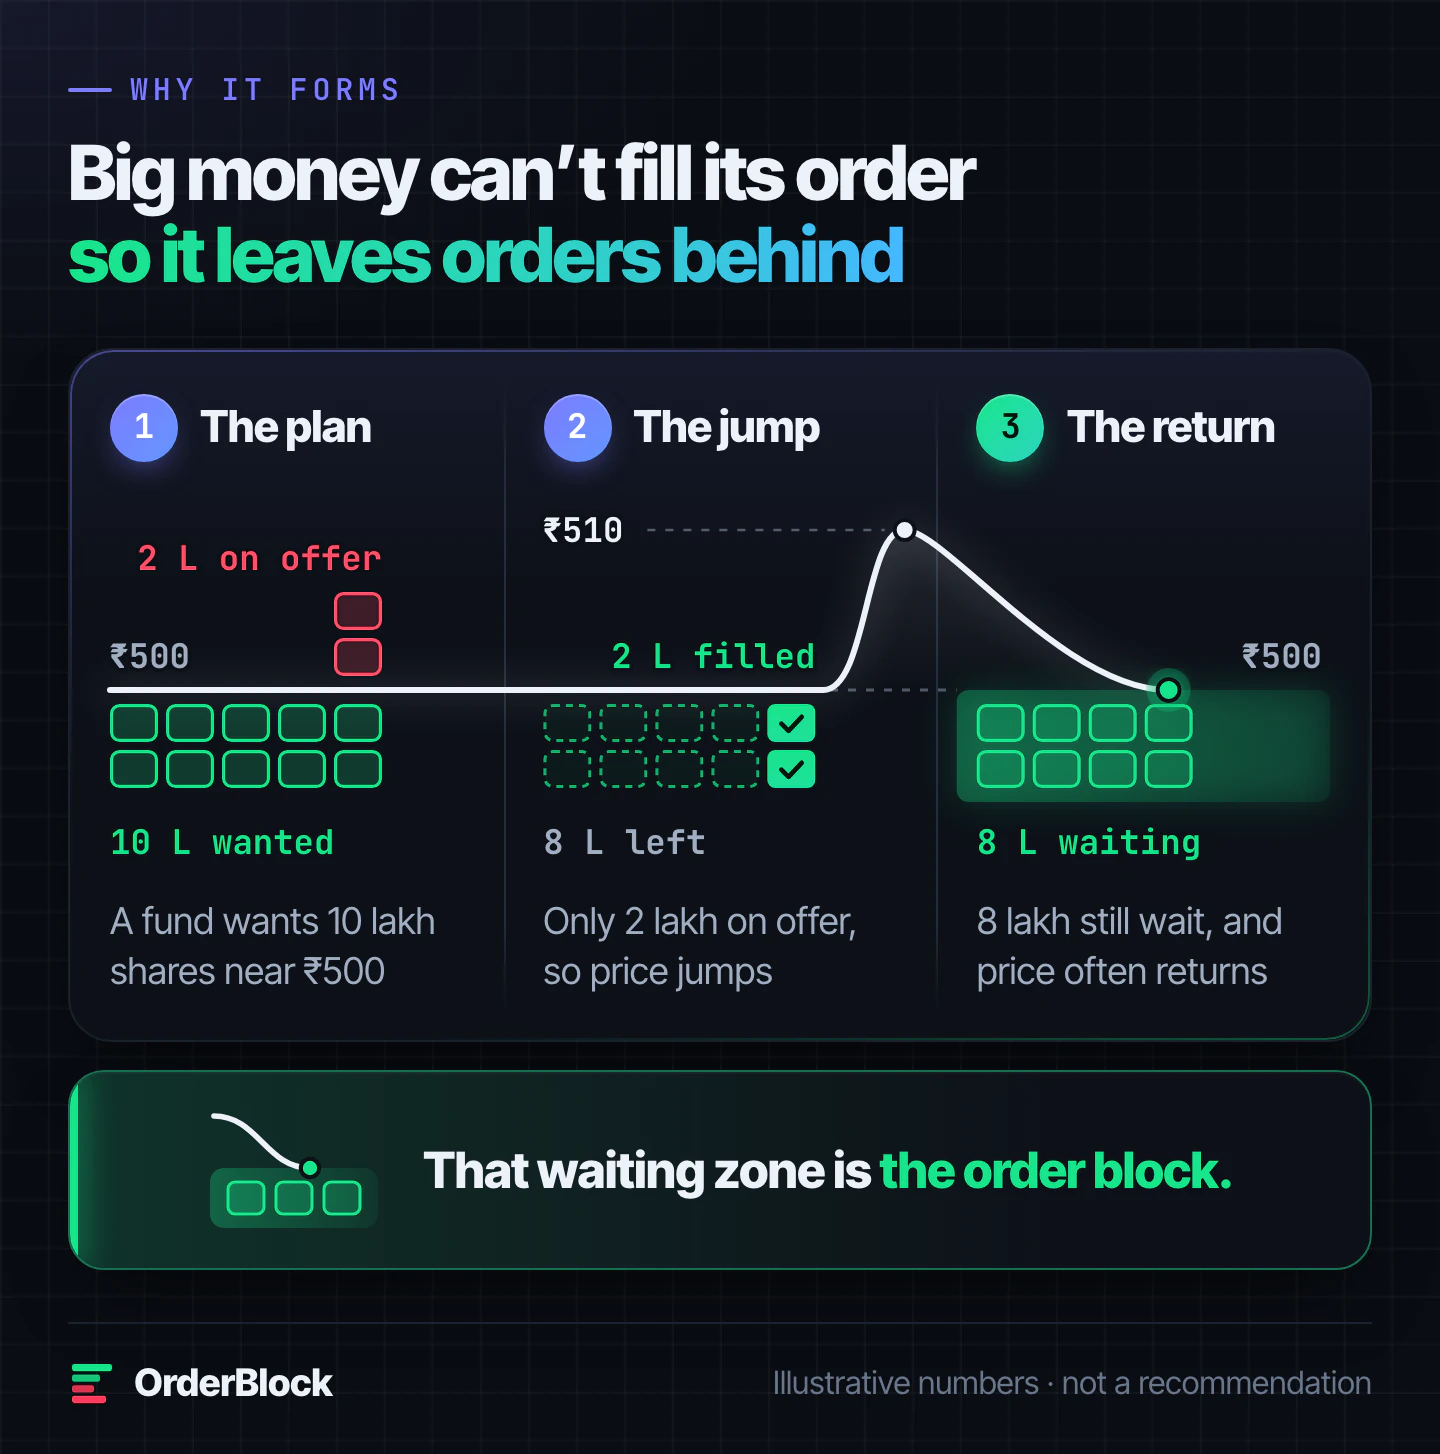
On the chart, the fund's first orders show up as the last red candle before the jump: price was still falling while the fund quietly took every share on offer. That candle marks the waiting area: the order block. It is a footprint, the place where a big player started and may still have orders left to fill.
Bullish vs bearish order blocks
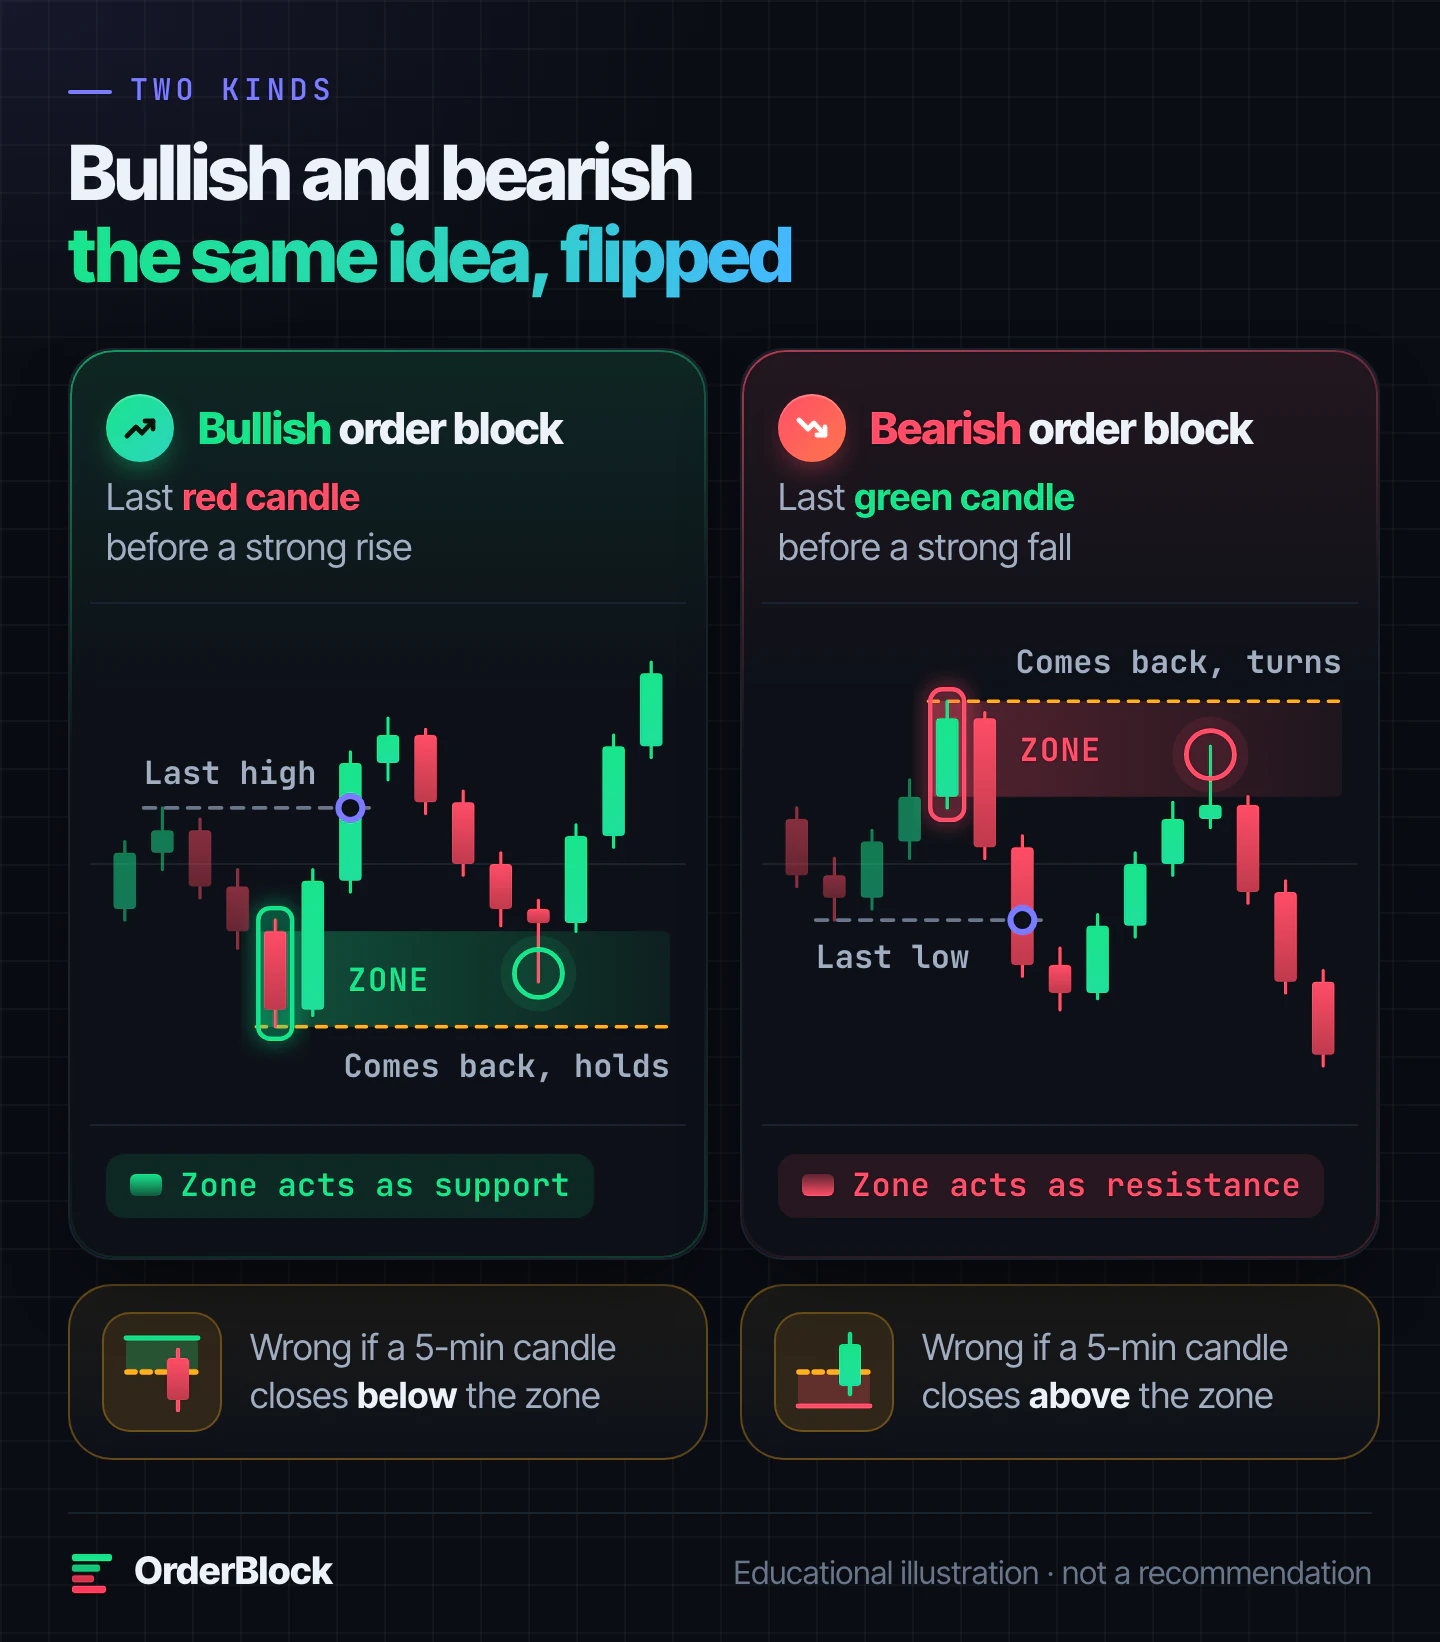
- Bullish order block: the last red candle before a strong rise. The zone sits below price and acts as support. The idea is wrong if a 5-minute candle closes below the zone.
- Bearish order block: the last green candle before a strong fall. The zone sits above price and acts as resistance. The idea is wrong if a 5-minute candle closes above the zone.
If you can read one, you can read the other.
How to find an order block in 3 steps
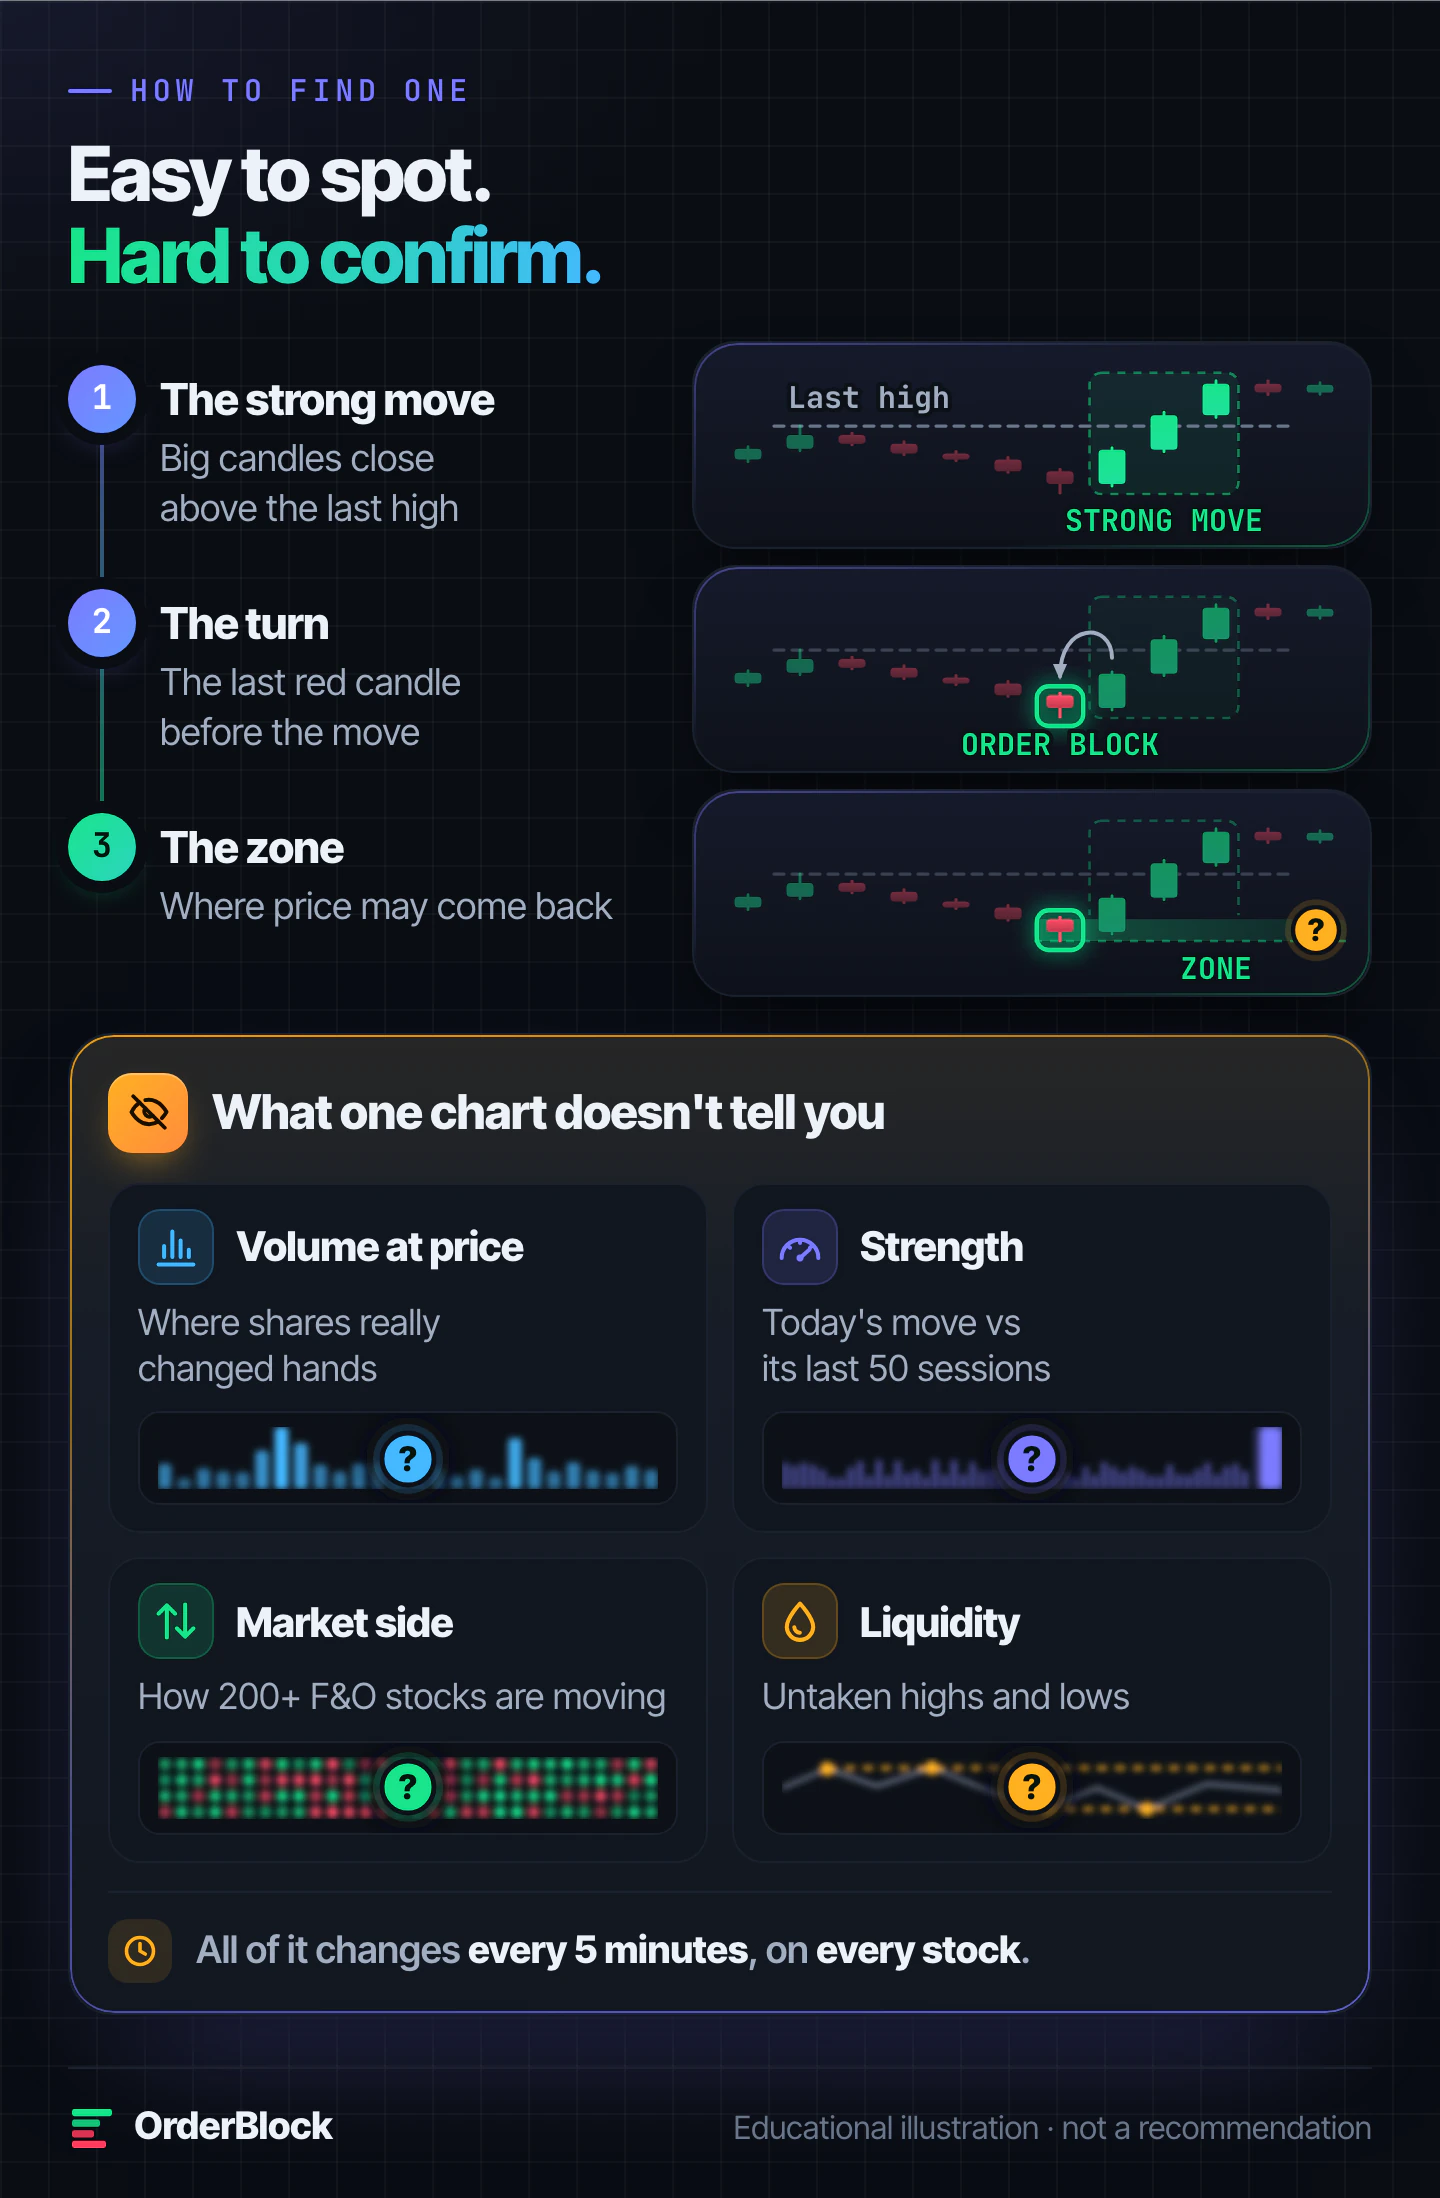
On a chart, every order block has the same three-part shape:
- The strong move. Big candles close above the last swing high (bullish) or below the last swing low (bearish). A swing high is a peak with lower highs on both sides. Only a close counts, not a wick (the thin line above or below a candle's body). Traders call this a break of structure.
- The turn. The move began from the last red candle before the rise, or the last green candle before the fall. That candle is the order block.
- The zone. The order block becomes a zone that price may come back to.
That is the easy part. The catch: a chart shows the shape of a move, not the money behind it. Any chart has dozens of red candles before a rise, and most of them are noise.
How to identify a valid order block
A valid order block has real weight behind it, not just the right shape. To tell it apart from a lookalike, one chart is not enough. You need data on the whole market, and strict rules:
- Volume. Where the shares really changed hands today, so you can see if the zone sits where trading was heavy.
- Strength. How far the stock is moving today compared with its own last 50 sessions. Unusual moves are where big players tend to be busy.
- The market's side. How many of the 200+ F&O stocks are moving the same way. A bullish zone on a day when most stocks fall swims against the tide.
- Liquidity. The highs and lows no candle has closed beyond yet. Stop orders pile up there, and price is often drawn to them.
- Strict rules. The break must be a close, the move away must be fast, and no 5-minute candle may have closed through the zone since.
A normal chart app shows one stock at a time, so none of this sits on one screen. And all of it changes every five minutes, on every stock at once.
Liquidity: the other half of the picture
Order blocks show where big players placed orders. Liquidity shows where they find enough orders on the other side to fill theirs.
Most traders put their stop orders in the same obvious places: just below equal lows (two or more lows at the same price) or just above equal highs. Those piles of resting orders are liquidity, and a big player often has to go and get them.
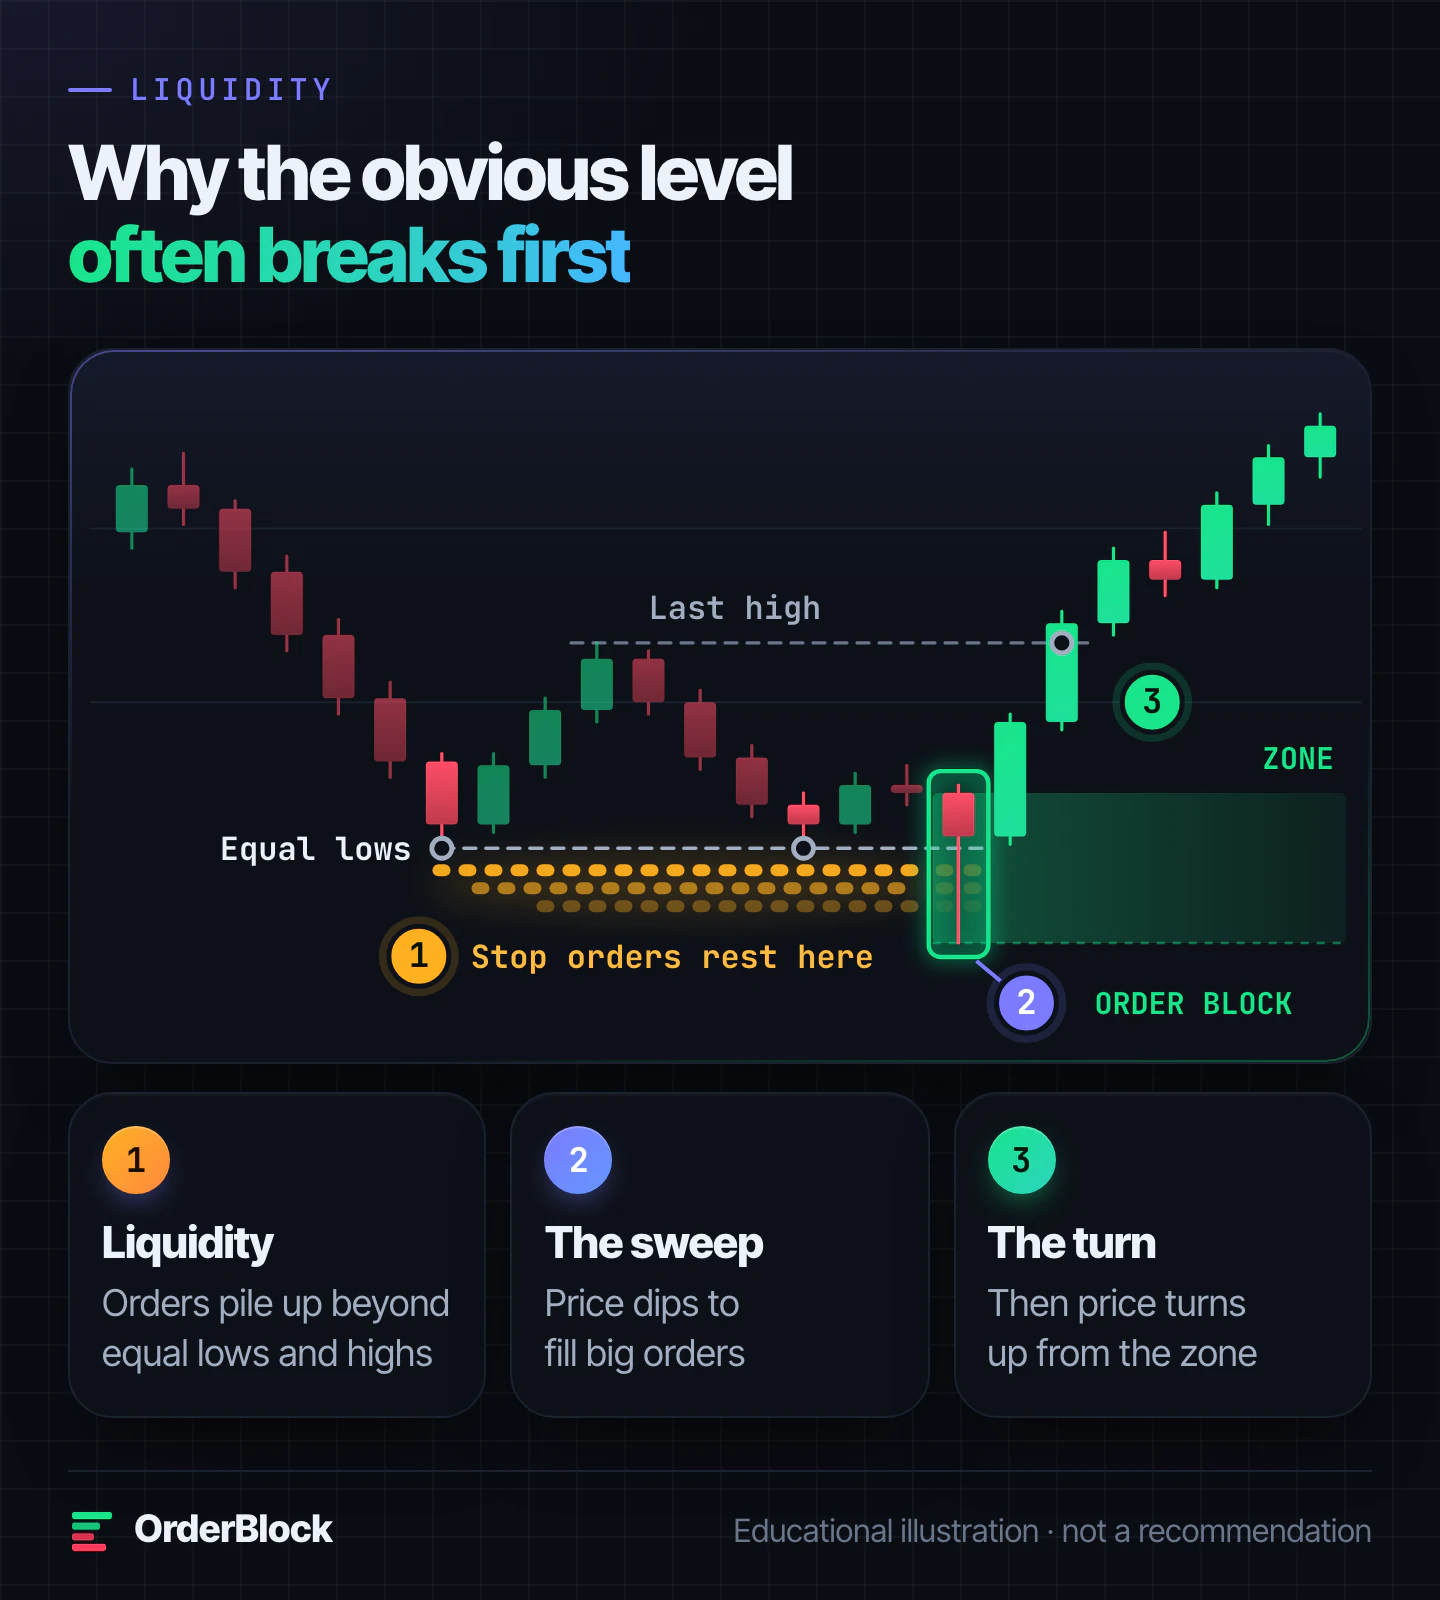
That is why the obvious level so often breaks first. Price dips under the equal lows and sets off the resting orders. That gives the big player the other side it needs. Then price turns up from the order block. To the trader whose stop was hit, it feels like a trap. To someone who had marked the order block and the liquidity, it was a path they had planned for.
Order blocks show where big money may be waiting. Liquidity shows where price may reach first.
What is the best timeframe for order blocks?
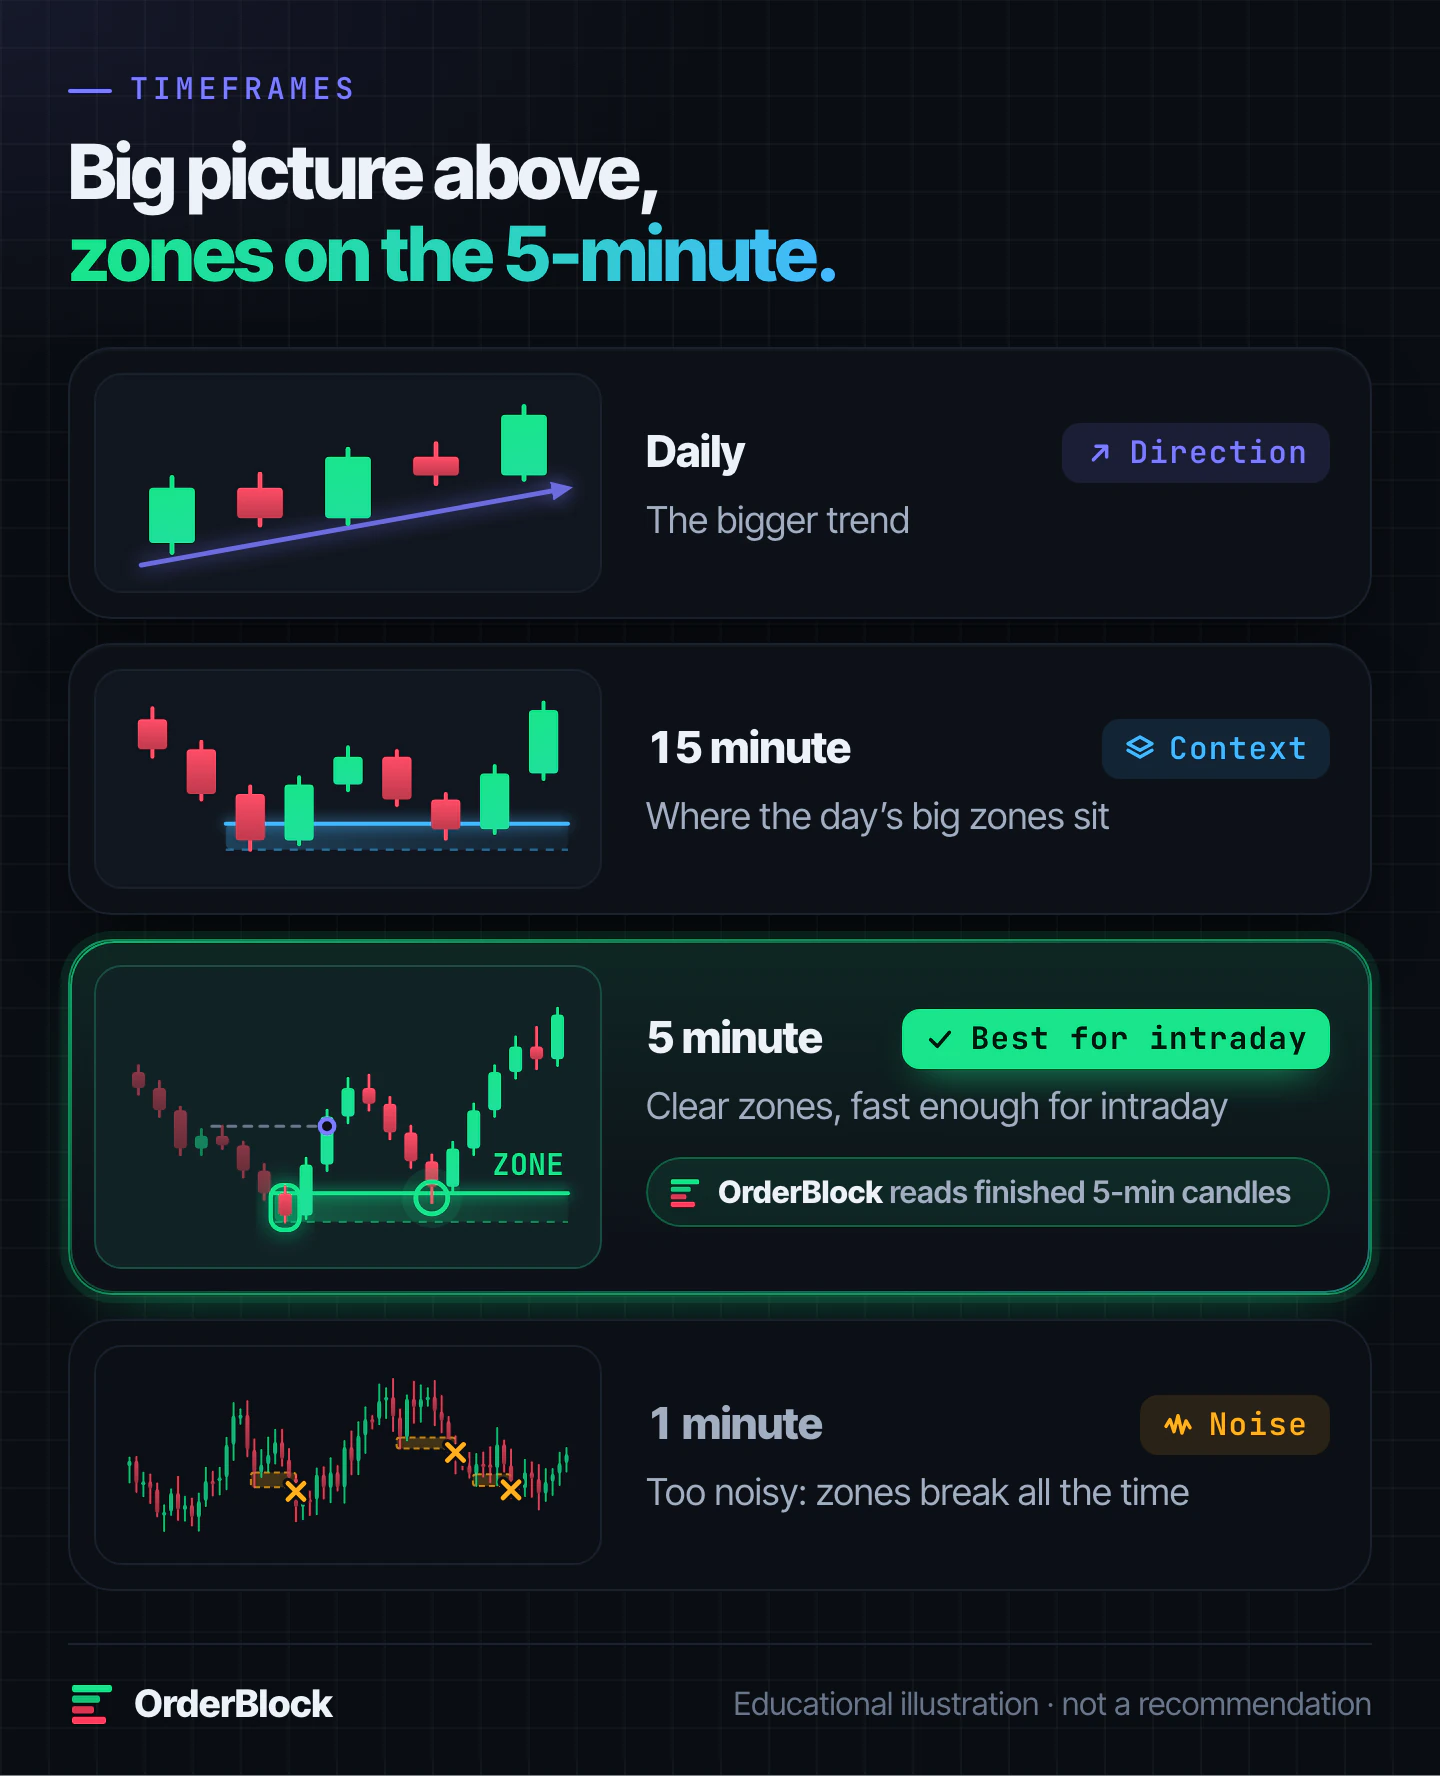
There is no perfect timeframe, but there is a sensible split:
- Daily: the bigger trend.
- 15-minute: where the day's important zones sit.
- 5-minute: the sweet spot for intraday F&O, clear enough to read and fast enough to use the same day.
- 1-minute: too noisy for most people. Zones form and break all day.
OrderBlock reads finished 5-minute candles for exactly this reason. It waits for each candle to close, so an order block is never drawn from a candle that is still moving. The levels around it are then updated every minute against the live price.
5 mistakes that trap new traders
- Chasing price far from the zone. By the time a move looks obvious, the zone, and the level where you are wrong, are far behind. Let the zone come to you.
- Marking every red candle. No close beyond a high or low, no order block.
- Ignoring the market. A bullish zone on a day when most stocks fall swims against the tide. Read the market first.
- Ignoring the liquidity ahead. If a recent high that no candle has closed above sits just above the zone, the move may stall there, leaving too little room for the risk you take.
- Not deciding where you are wrong. Every zone has a far edge. A 5-minute close beyond it ends the idea.
Why finding order blocks by hand is so hard
Even on one chart, the shape is only half the answer. Now try it in a live market.
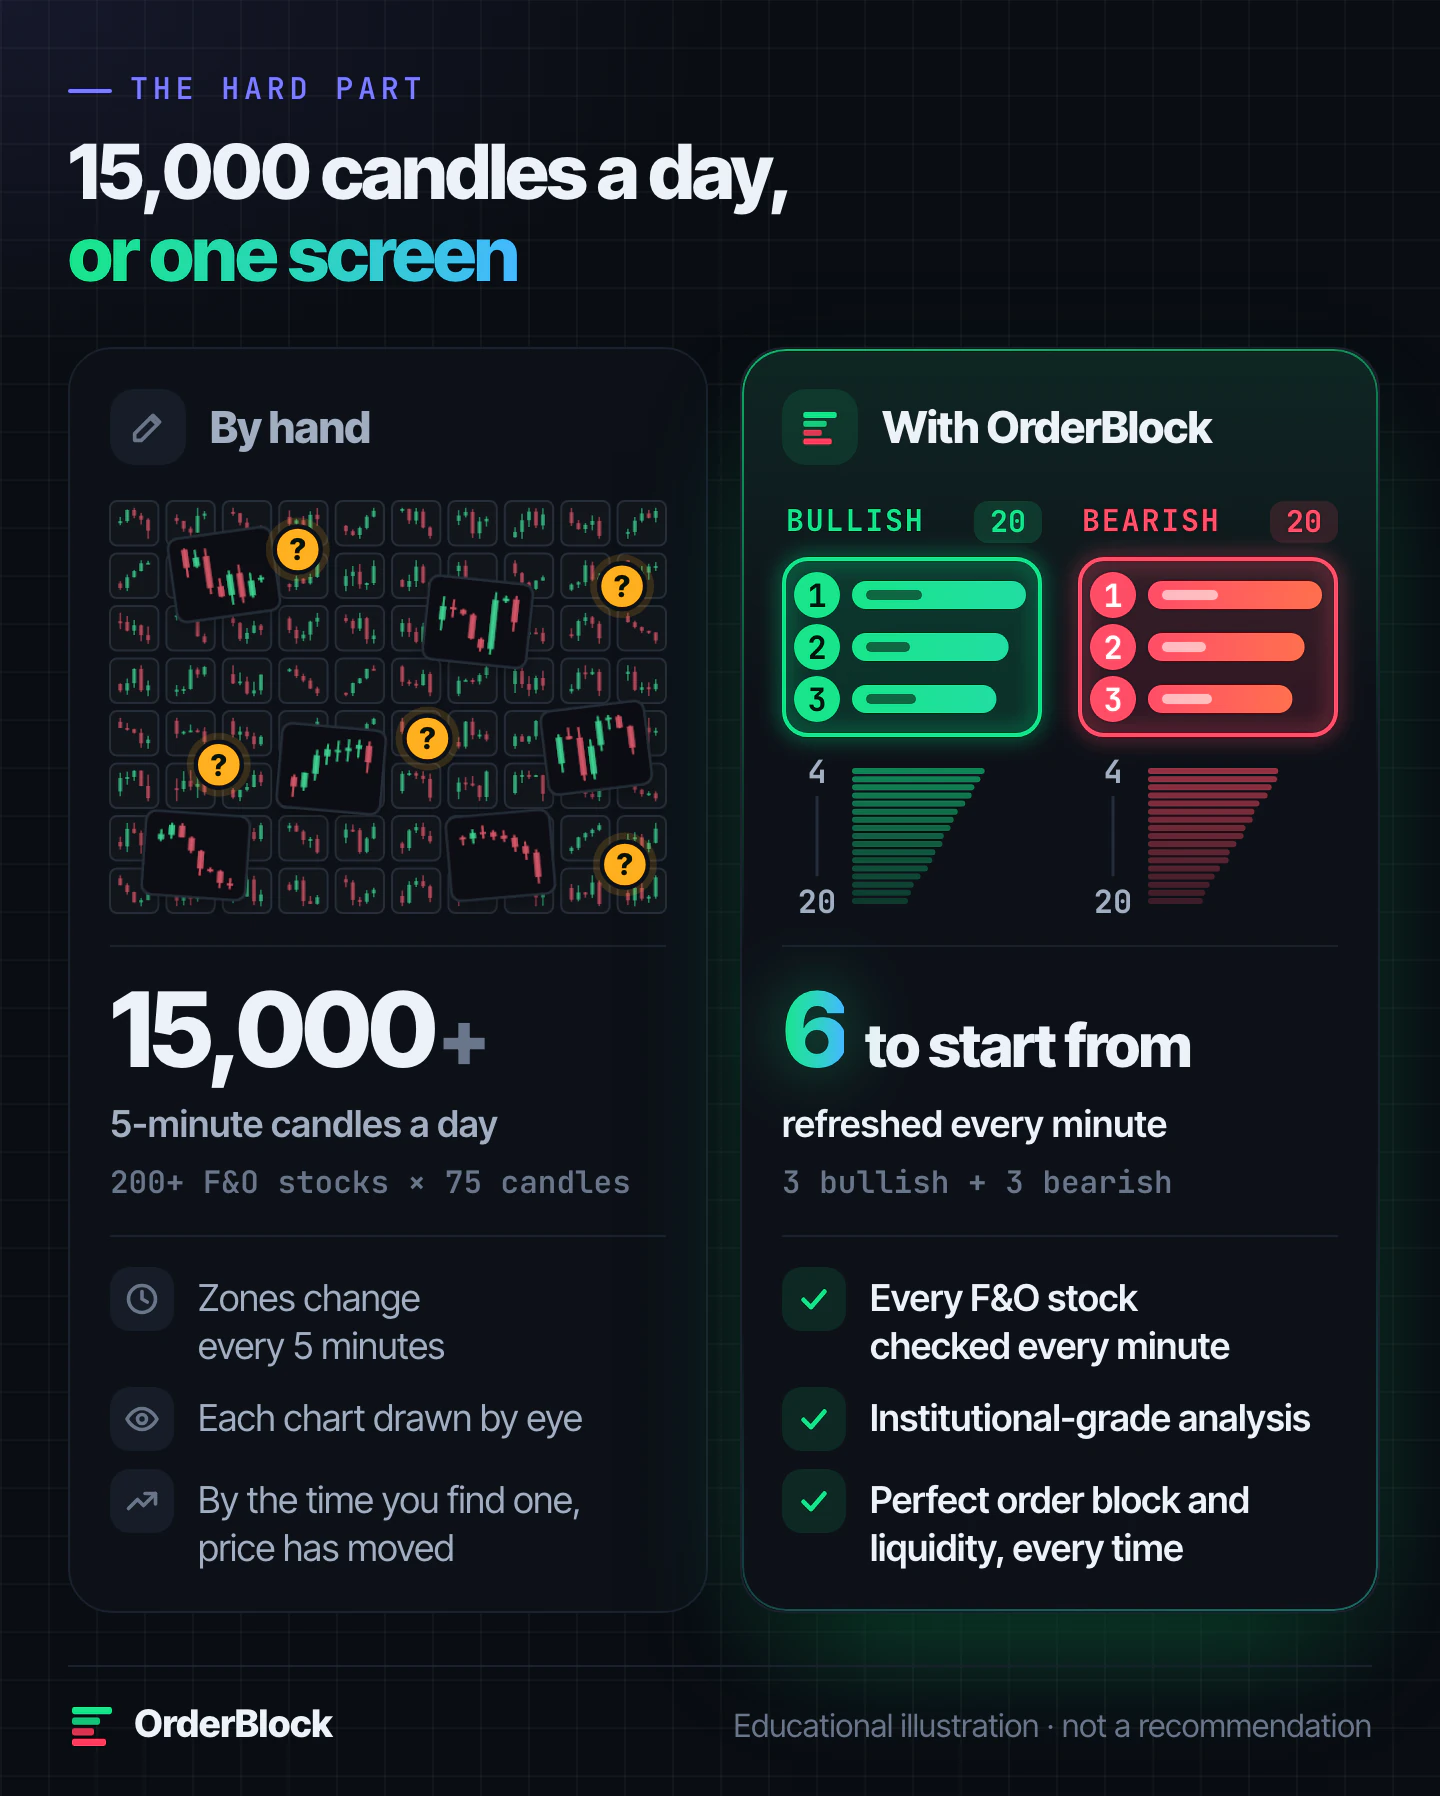
There are more than 200 F&O stocks, and each one makes 75 five-minute candles a day. That is over 15,000 candles to read, and every likely order block still needs its volume, its strength and the liquidity around it checked. Meanwhile the picture changes every five minutes: highs break, new order blocks form, old zones fail. By the time you have checked 30 charts and drawn your boxes, the cleanest setup of the morning has already left its zone.
Most beginners don't struggle because order blocks are hard to understand. They struggle because they find them too late, on the wrong stock, on the wrong day. And by hand, the boxes change with your mood: drawn one way on a calm morning, another way after a loss. Consistency starts with the same rules, applied the same way, on every chart.
OrderBlock: a live order block screener for Indian F&O stocks
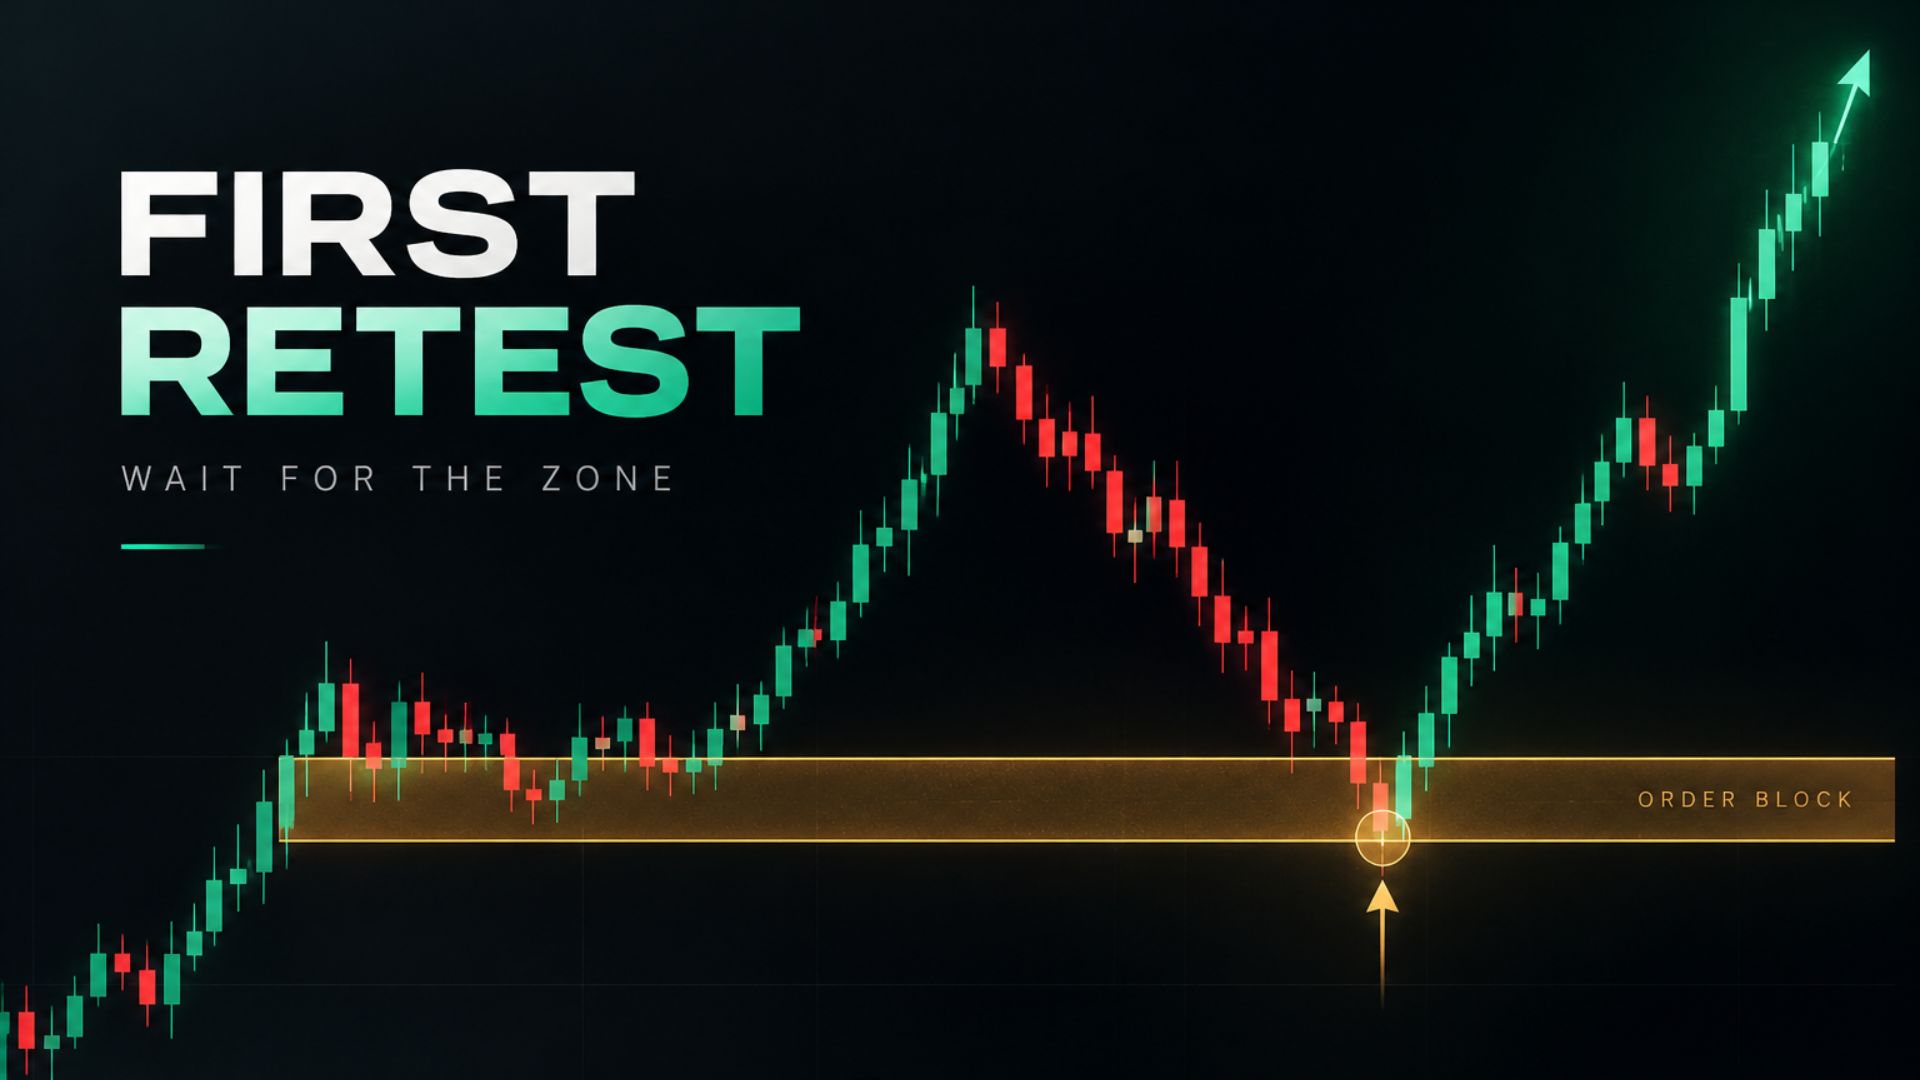
OrderBlock does the searching for you, every minute, across every F&O stock. It ranks each one by how strongly it is moving against its own last 50 sessions, reads which side the market is on, and shows where the volume traded. On the 20 strongest on each side, it draws the order block with the strict rules above, then marks the level where the setup is wrong and the next levels ahead, placed at liquidity whenever there is some in range. Here are the same rules, replayed on a real past session:
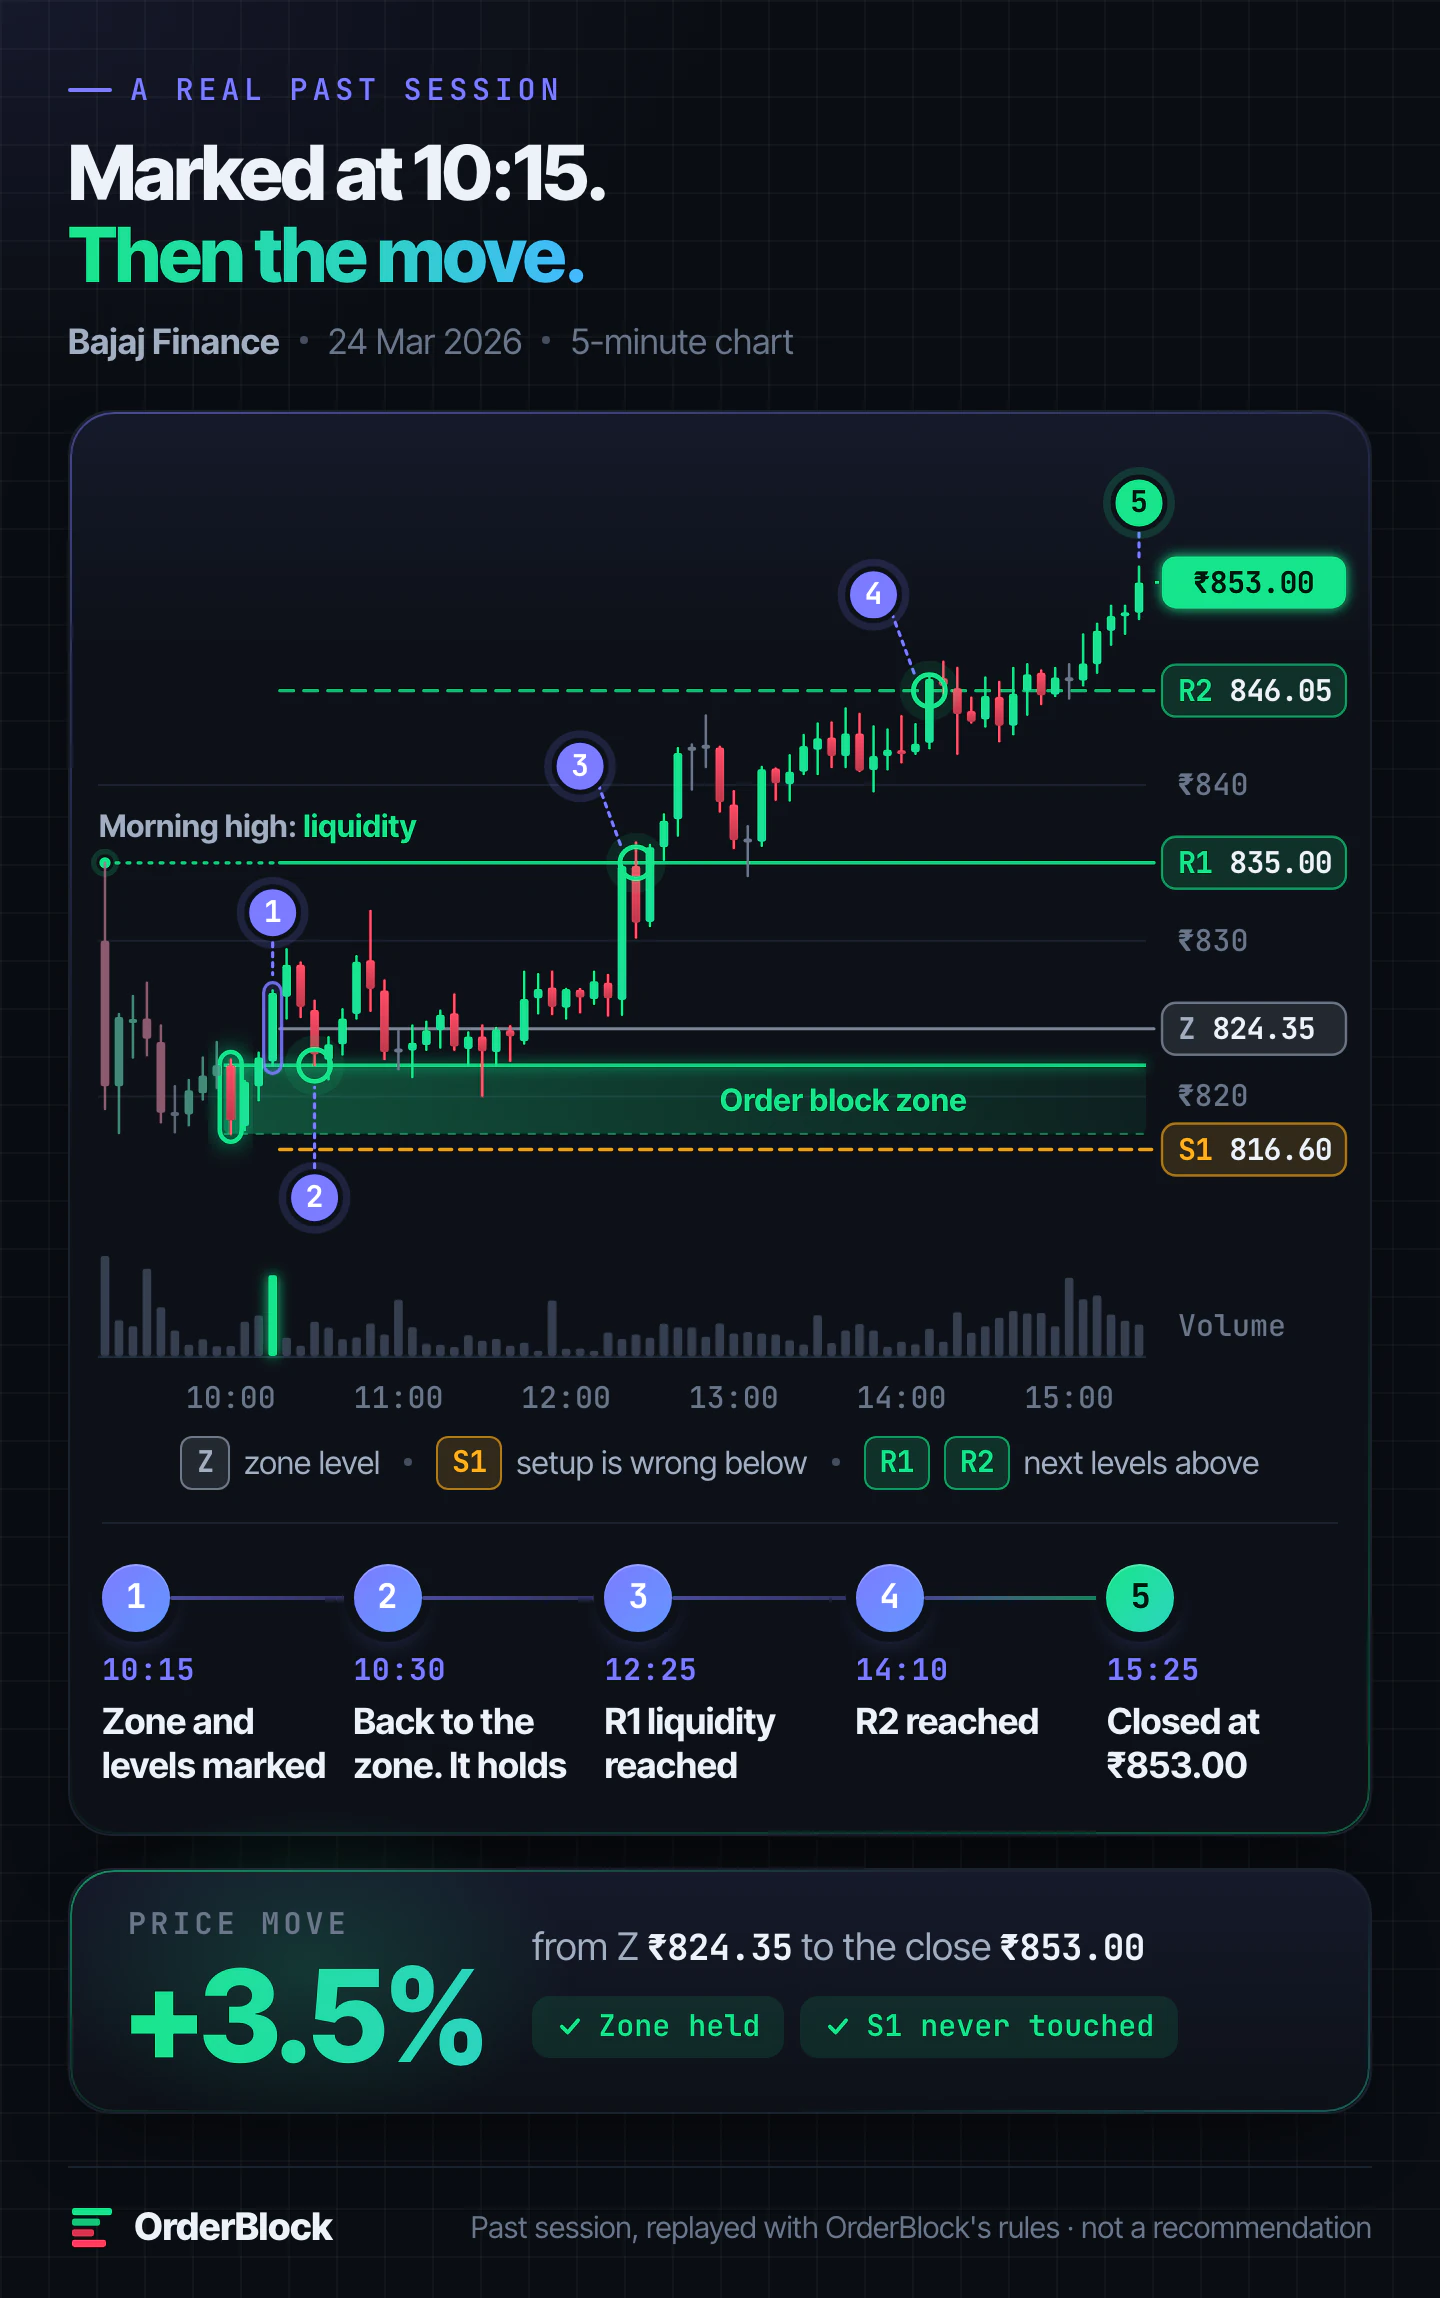
Not every zone holds like this one. When one fails, S1 tells you early, while the move against you is still small.
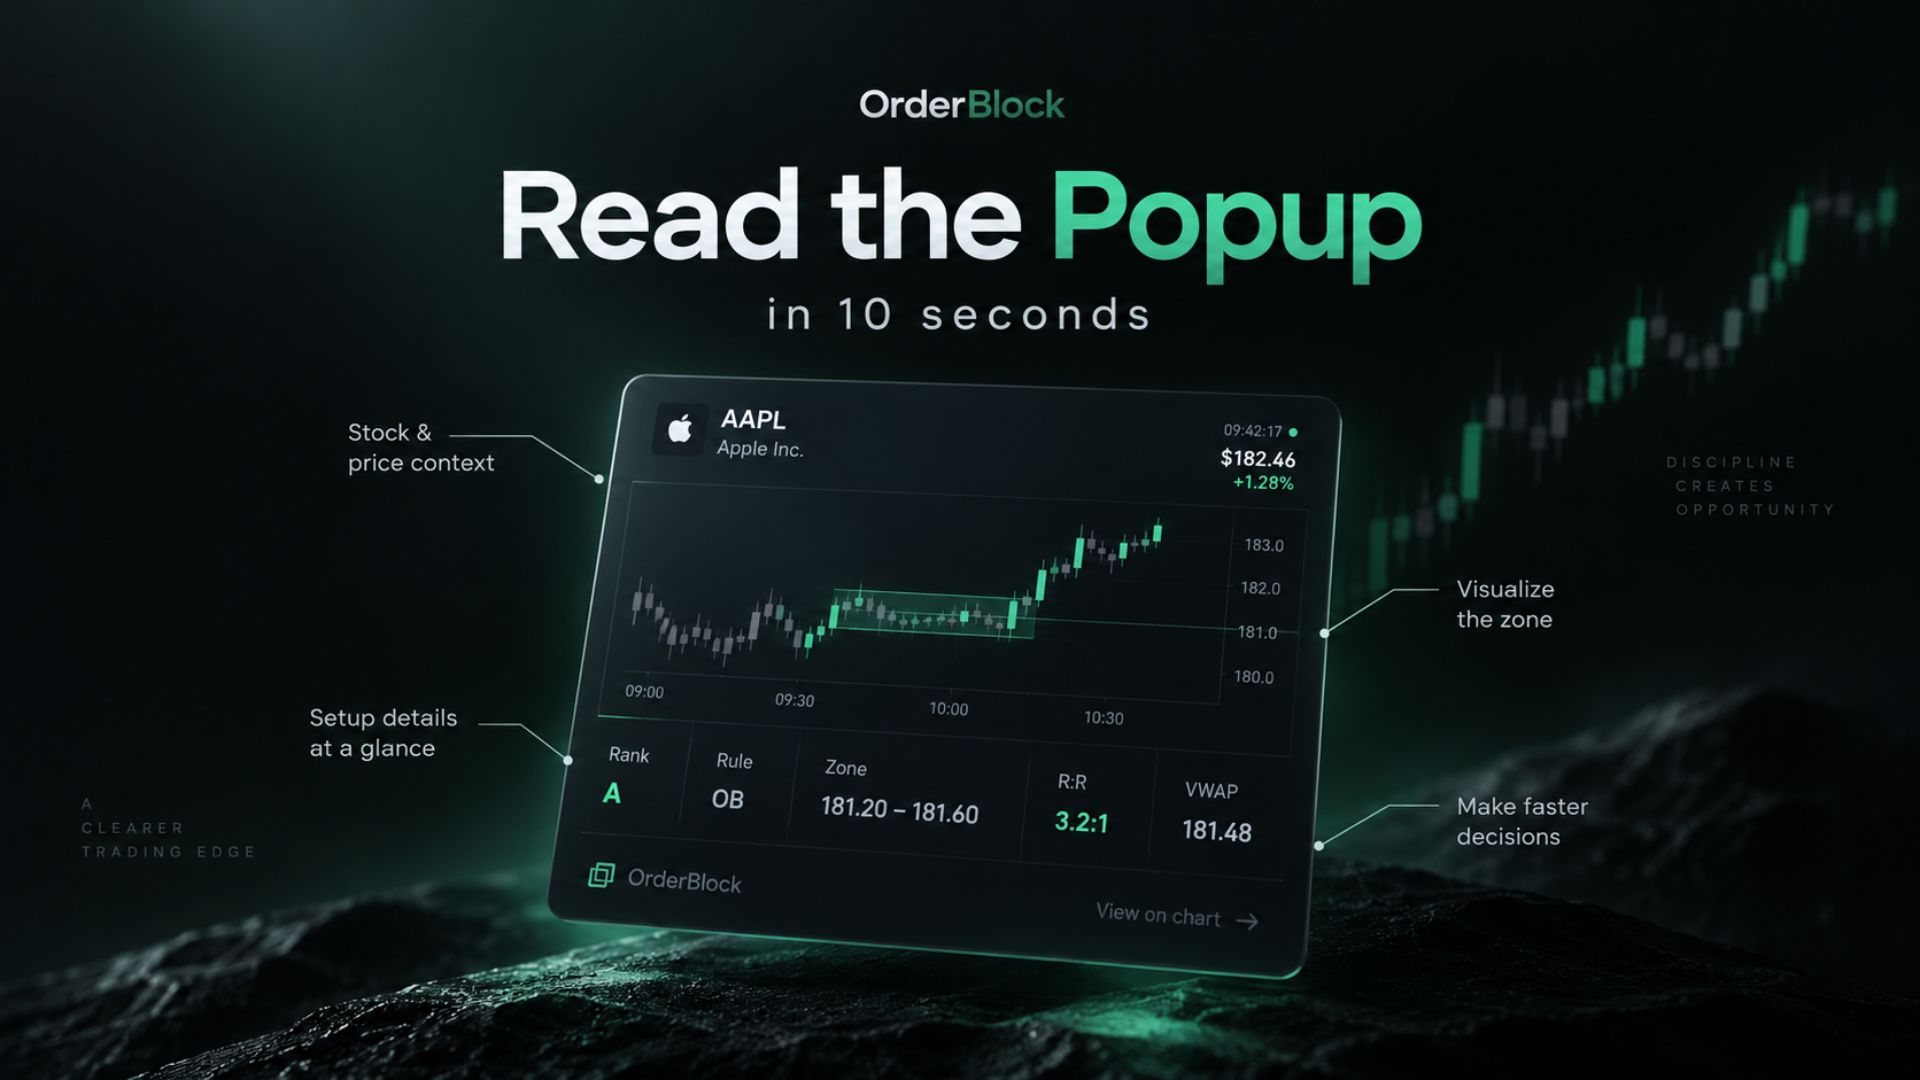
You still make every decision. OrderBlock removes the searching, so your attention goes to a few clean charts instead of two hundred messy ones. Here is how to read a popup in 10 seconds.
What members say
Order blocks used to be something I understood only in theory. Here they become much easier to apply in an actual live-market workflow.
Naveen Saran, price action learner, Hisar
The combination of liquidity zones and order blocks saves me a lot of manual chart marking. My prep is much faster and cleaner now.
Abhishek Tiwari, price action trader, Lucknow
Let OrderBlock do the searching. See plans and open the live terminal, or read more member reviews first.
Order block vs fair value gap (FVG)
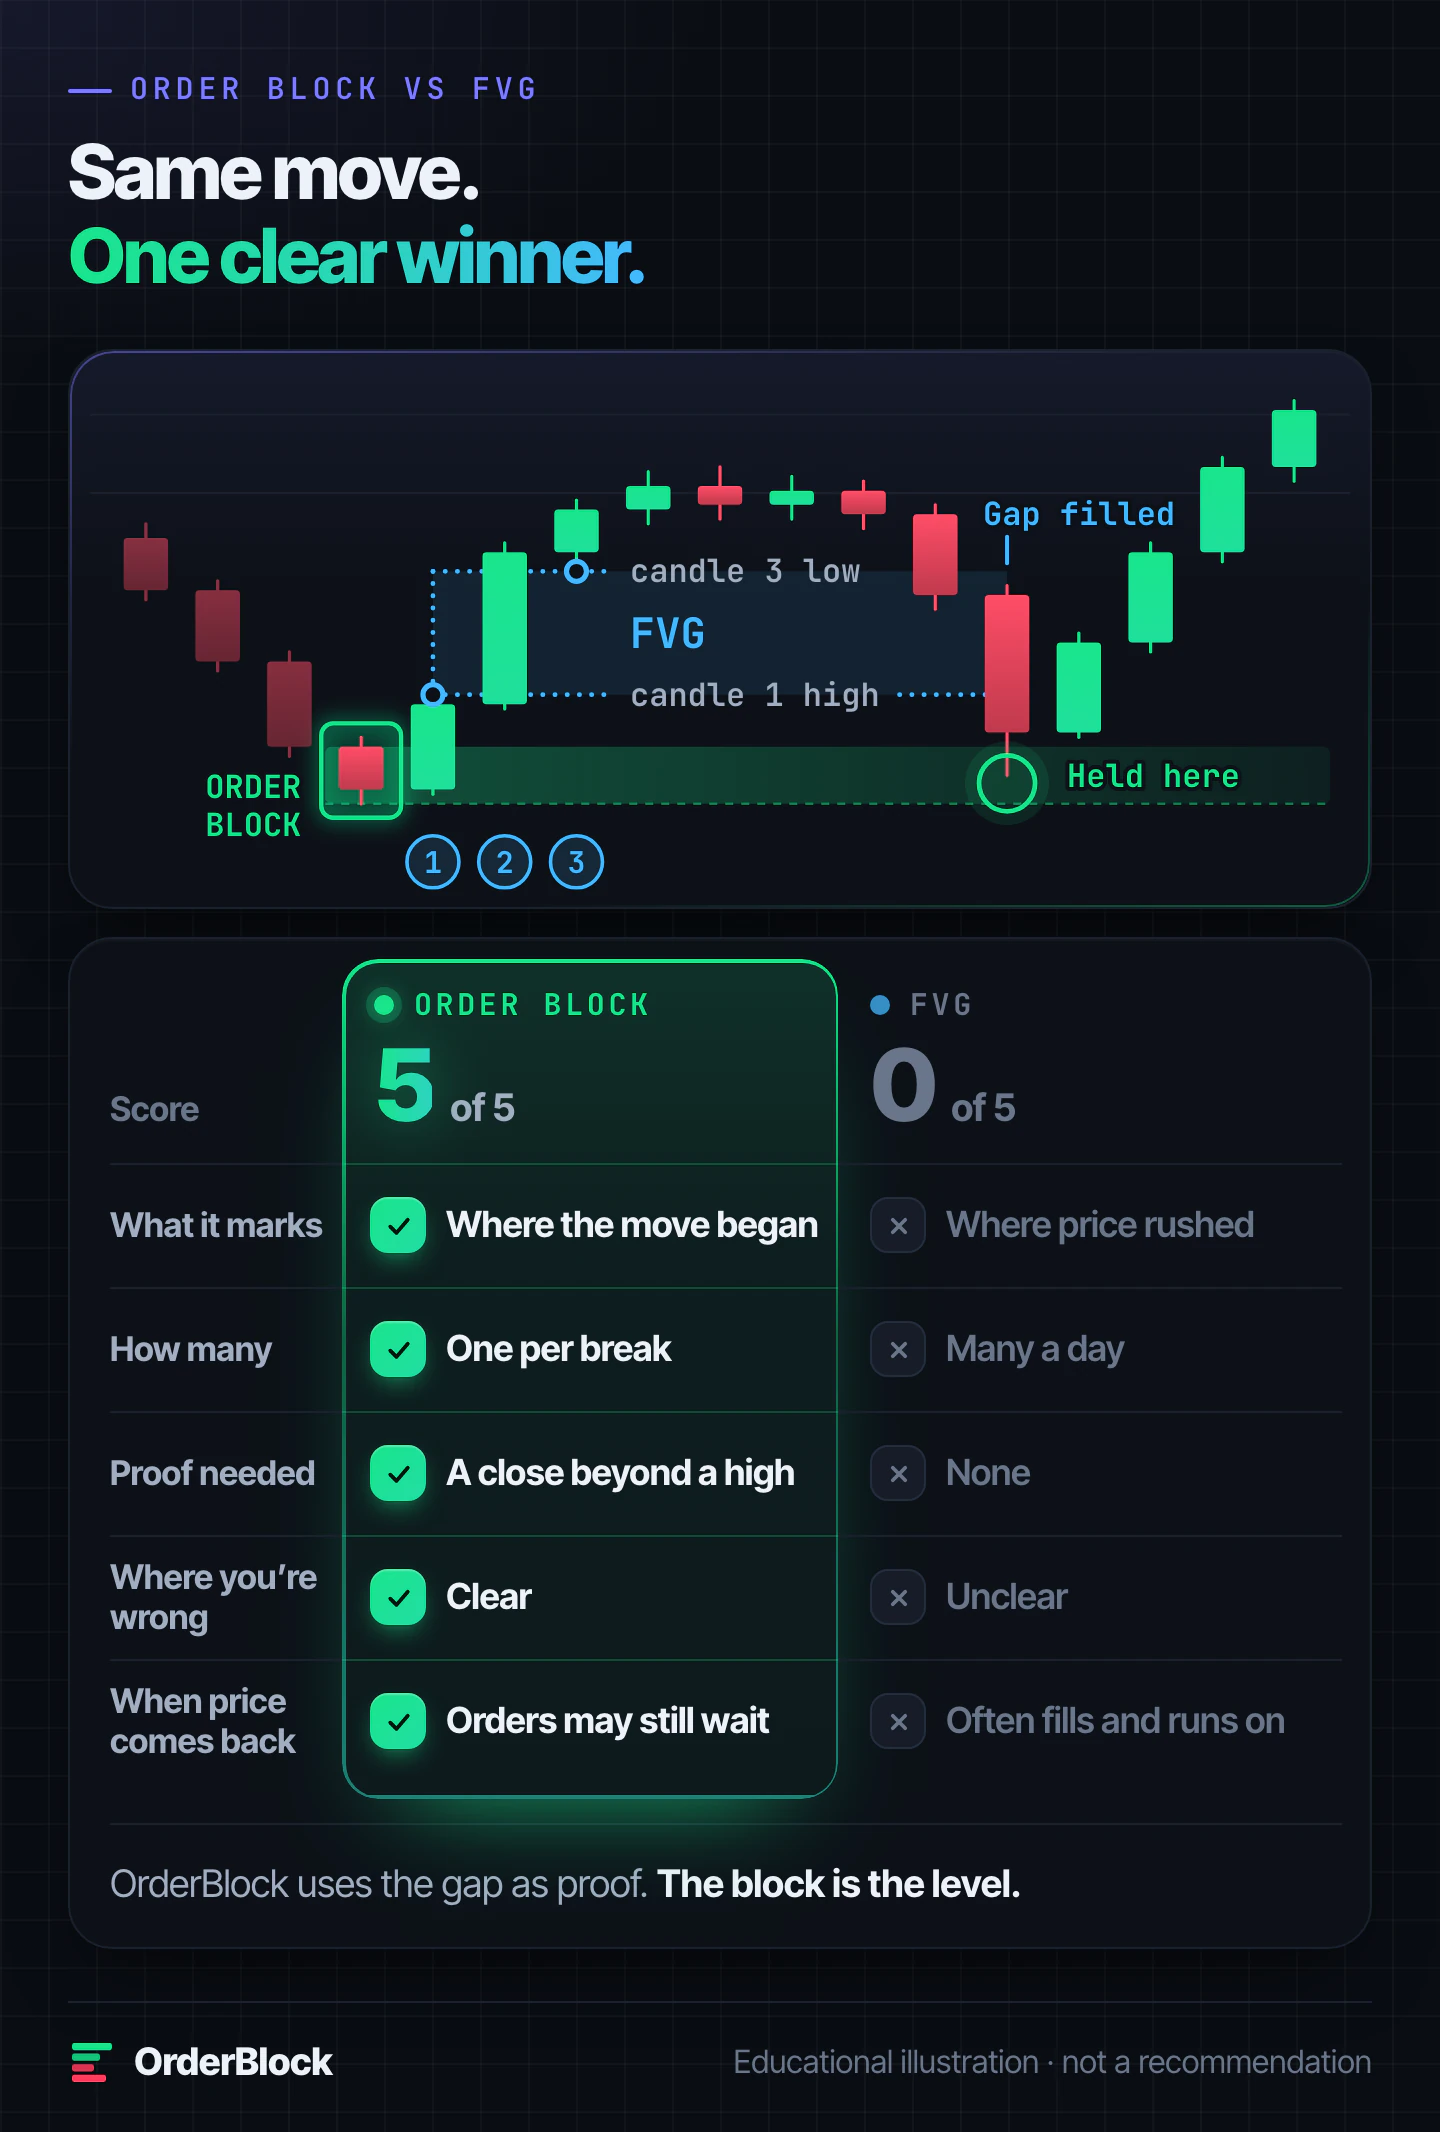
A fair value gap (FVG) is a gap inside a fast move, three candles long. In a fast rise, the middle candle moves so far that the first candle's high and the third candle's low don't overlap. The empty space between them is the gap (in a fast fall, it is the mirror). An order block is the single candle where that move started.
Both come from the same move, but only one shows where the big orders likely sat. That makes the order block the far stronger level:
| Order block | Fair value gap | |
|---|---|---|
| What it marks | Where the move began, where big orders were likely placed | Where price rushed, a side effect of the move |
| How many | One for each break of structure | Many a day: a fast candle often leaves one |
| Proof needed | A close beyond a recent high or low | None: any fast candle can leave one |
| Where you are wrong | Clear: a close beyond the zone | Unclear: price can run straight through the gap |
| When price comes back | Big orders may still be waiting | The gap often fills and price runs on |
That is why OrderBlock treats a gap as proof, not as the level. A move away from an order block only counts if it leaves a gap, or closes beyond the block by at least the size of an average candle. The gap shows the move was real. The order block is where to watch.
Order block vs supply and demand zone
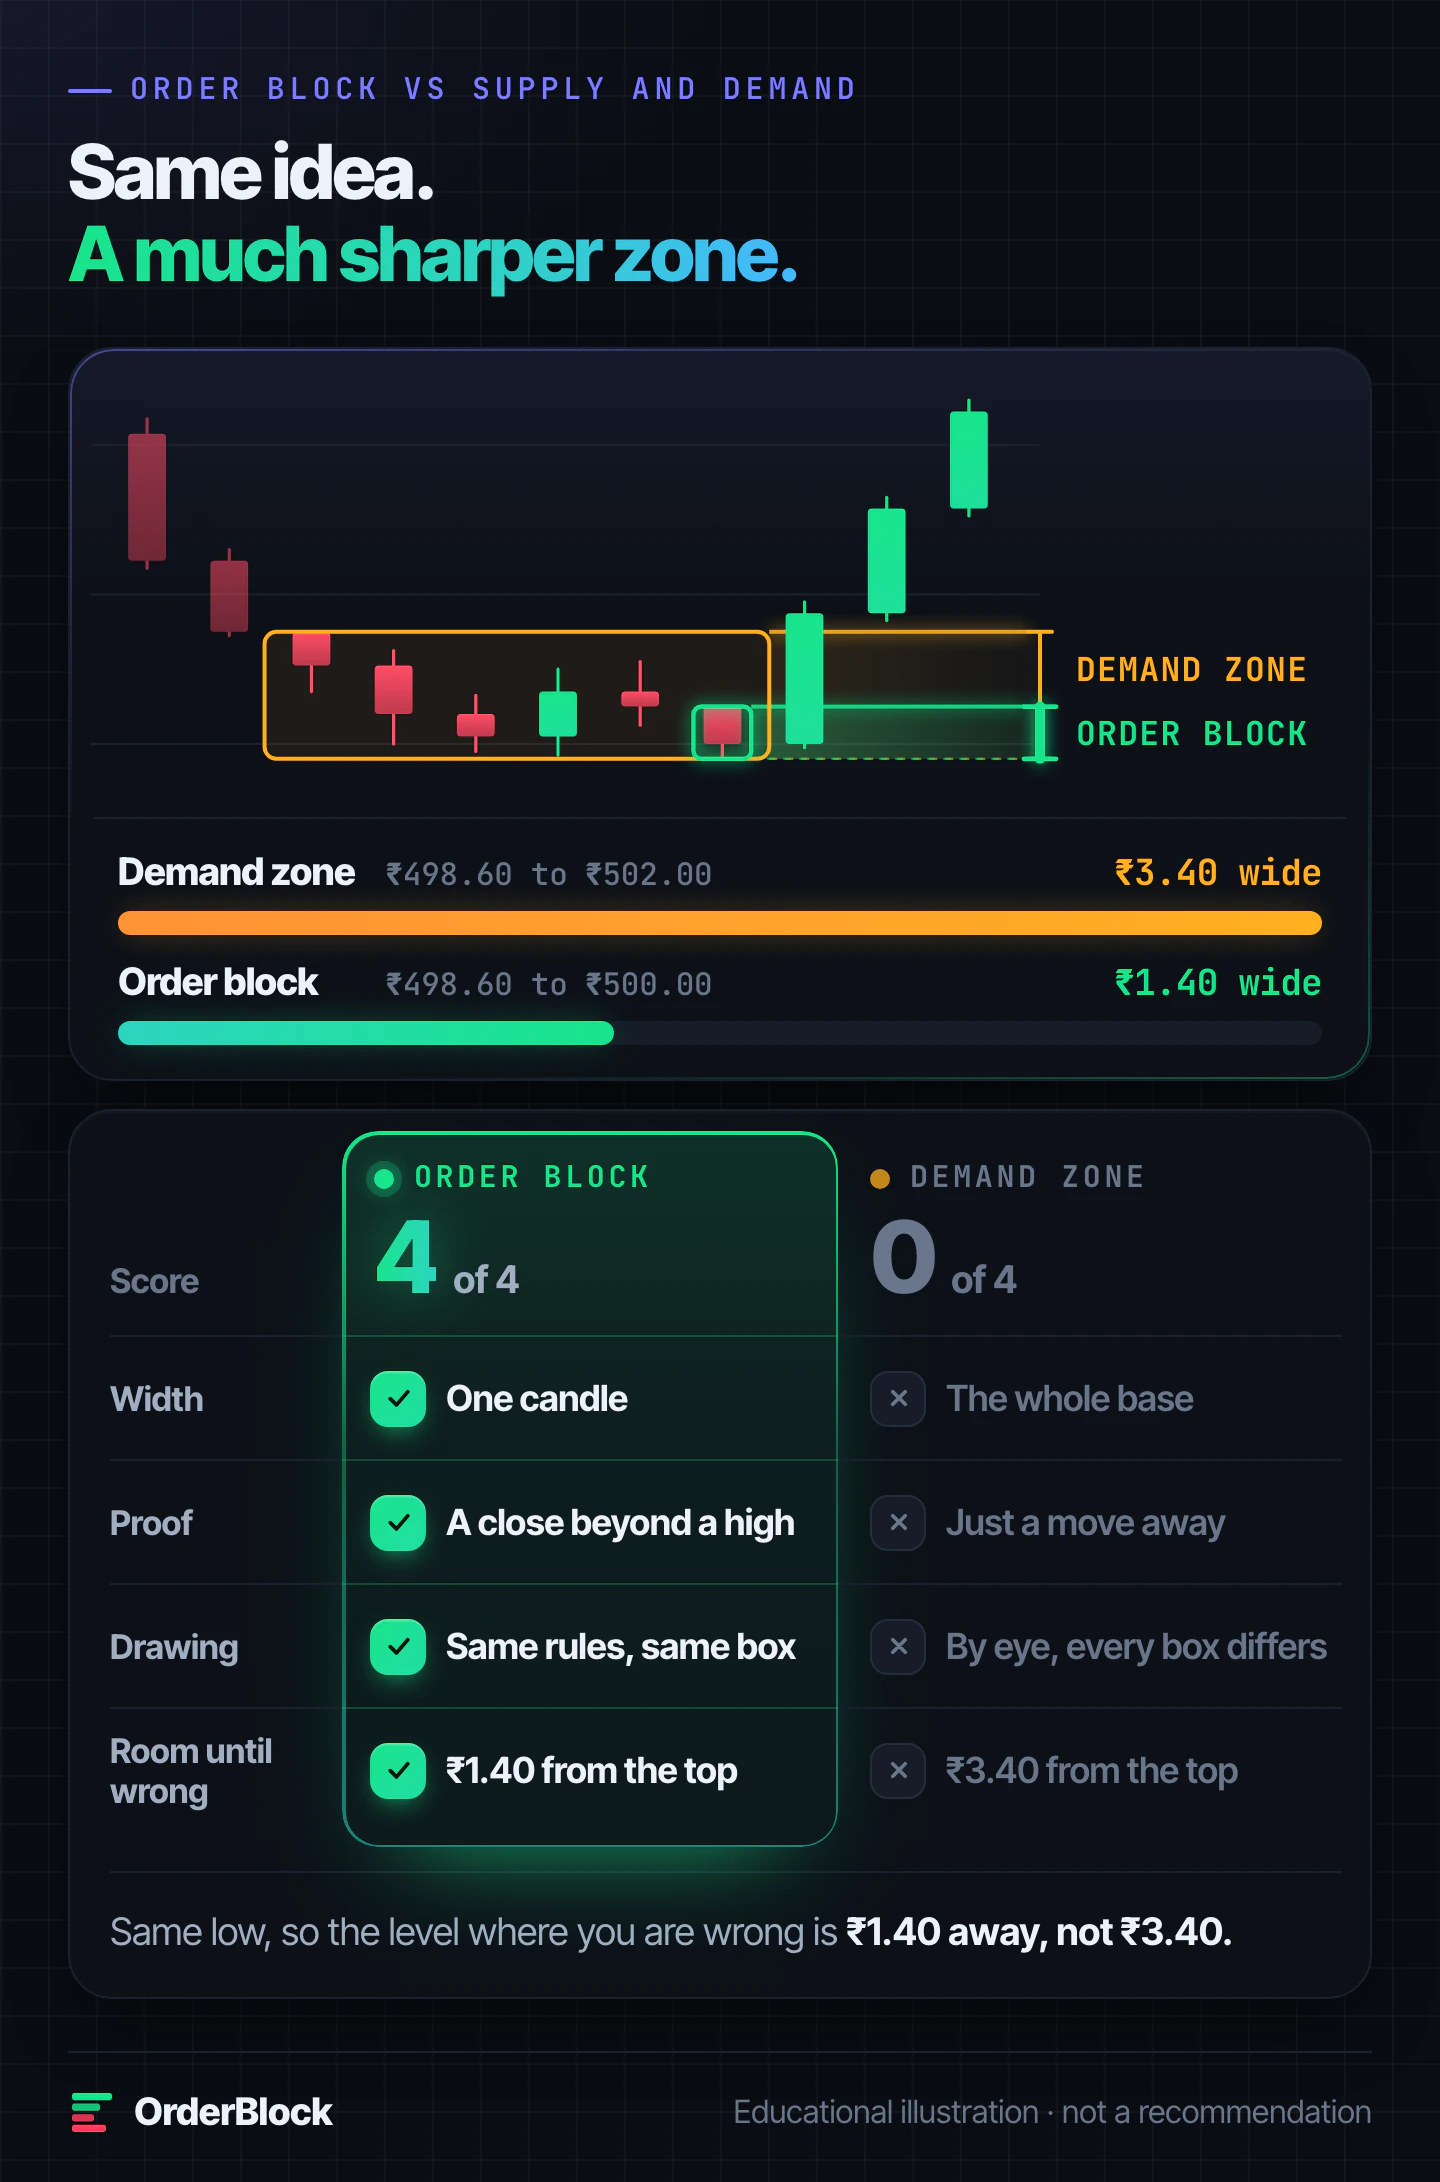
Supply and demand zones are the older, wider version of the same idea. A demand zone usually covers a whole base: several small candles where price paused before a rally. An order block narrows that down to the one candle where the move actually began. That makes it the far sharper tool:
- Tighter. One candle instead of a whole base, so the level where you are wrong sits much closer. If the zone fails, the loss on each share is smaller.
- Proven. An order block needs a close beyond a recent high or low. A demand zone only needs price to move away from it.
- The same every time. Two traders using the same rules draw the same order block. Ask two traders to draw a demand zone and you will often get two different boxes.
A tight zone can also fail faster. Even then it helps: you find out early, after a small move against you.
See order blocks on the strongest stocks, live
Learning what an order block looks like takes an afternoon. Finding the ones that matter, across 200+ F&O stocks, as every 5-minute candle changes the picture, takes data and speed no one has by hand. OrderBlock does that searching for you every minute: it ranks the whole market, then draws the order block and the levels ahead on the 20 strongest stocks on each side, so your attention goes into your own decision.
See plans and open the terminal